[Updated 1 December 2017 with reissued Place of Work data]
The ABS has now released all census data for the 2016 journey to work. This post takes a city-level view of mode share trends. It has been expanded and updated from a first edition that only looked at place of work data.
My preferred measure of mode share is by place of enumeration – ie how did you travel to work based on where you were on census night (see appendix for discussion on other measures).
I’m using Greater Capital City Statistical Areas (GCCSA) geography for 2011 and 2016 and Statistical Divisions for earlier years. For Perth, Melbourne, Adelaide, Brisbane and Hobart the GCCSAs are larger than the Statistical Divisions used for earlier years, but then those cities have also grown over time. See appendix 1 for more discussion.
Some of my data goes back to 1976 – I’ll show as much history as I have for each mode/modal combination.
Public transport mode share
Sydney continues to have the largest public transport mode share, and the largest shift of the big cities. Melbourne also saw significant positive mode shift, but Perth and particularly Brisbane had mode shift away from public transport.
There’s so much to unpack behind these trends, particularly around the changing distribution of jobs in cities that I’m going to save that lengthy discussion for another blog post.
But what about the…
Massive mode shift to “public transport” in Darwin?!?
[this section updated 26 Oct 2017]
Yes, I have triple-checked I downloaded the right data. “Public transport” mode share increased from 4.3% to 10.9%. The number of people reporting bus-only journeys went from 1648 in 2011 to 5661 in 2016, which is growth of 244%. There has also been a spike in the total number of journeys to work in 2011, 30% higher than in 2011, while population growth was 13%.
Here’s the percentage growth in selected journey types between 2011 and 2016:
Bus + car as driver grew from 74 to 866 journeys, which reflects the establishment of park and ride sites around Darwin for the special commuter buses. Bus only journeys increased from 1953 to 5744. So it looks like most workers are getting the bus from home and/or forgot to mention the car part of their journey (in previous censuses I’ve seen many people living kilometres from a train station saying they got to work by train and walking only).
So this new project has swamped organic trends, although it is quite plausible that some people have shifted from cycling/walking to local jobs to using buses to commute to the LNG project (which is outside urban Darwin). When I look at workplaces within the Darwin Significant Urban Area (2011 boundary), public transport mode share is 6.0%, in 2016, still an increase from 4.4% in 2011. More on that in a future post.
Train
Sydney saw the fastest train mode share growth, followed by Melbourne, while Brisbane and Perth went backwards.
Bus
Darwin just overtook Sydney for top spot thanks to the LNG project. Otherwise only Sydney, Canberra and Melbourne saw growth in bus mode share. Melbourne’s figure remains very low, however it is important to keep in mind that trams provide most of the on-street inner suburban radial public transport function in Melbourne.
Train and bus
Sydney comes out on top, with a large increase in 2016 (although much of this is still concentrated around Bondi where there are high bus frequencies and no fare penalties for transfers – more on that in an upcoming post). Melbourne is seeing substantial growth (perhaps due to improvements in modal coordination), while Perth, Adelaide and Brisbane had declines in terms of mode share (Brisbane and Adelaide were also declines on raw counts, not just mode share). I’m sure some people will want to comment about degrees of modal integration in different cities.
Train and bicycle
Some cities are also trying to promote the bicycle and train combination as an efficient way to get around (they are the fastest motorised and (mostly)non-motorised surface modes because they can generally sail past congested traffic). The mode shares are still tiny however:
Sydney and Melbourne are growing but the other cities are in decline in terms of mode share.
As this modal combination is coming off an almost zero base, it’s also probably worth looking at the raw counts:
The downturns in Brisbane and Perth are not huge in raw numbers, and probably reflect the general mode shift away from public transport (which is probably more to do with changing job distributions than bicycle facilities at train stations).
Cycling
I have a longer time-series of bicycle-only mode share, compared to “involving bicycle”, so two charts here:
Observations:
Darwin lost top placing for cycling to work with a large decline in mode share (refer discussion above about the massive shift to bus).
Canberra took the lead with more strong growth.
Melbourne increased slightly between 2011 and 2016 (note: rain was forecast on census day which may have suppressed growth, more on that in a moment).
Hobart had a big increase in 2016, following rain in 2011.
Sydney remains at the bottom of the pack and declined in 2016.
Walking and cycling mode share is likely to be impacted by weather. Here’s a summary of recent census weather conditions for most cities (note: Canberra minimums were -3 in 2001, -7 in 2006, 0 in 2011 and -1 in 2016):
Perth had rain on all of the last four census days, while Adelaide had significant rain only in 2001 and 2011 (and indeed 2006 shows up with higher active transport mode share). Hobart had significant rain in 2011, which appears to have suppressed active transport mode share that year.
But perhaps equally important is the forecast weather as that could set people’s plans the night before. Here was the forecast for the 2016 census day, from the BOM website the night before:
Note that it didn’t end up raining in Melbourne, Adelaide, or Hobart.
The census is conducted in winter – which is the best time to cycle in Darwin (dry season) and not a great time to cycle in other cities. However the icy weather in Canberra clearly hasn’t stopped it getting the highest and fastest growing cycling mode share of all cities!
Indeed here is a chart from VicRoads showing the seasonality of cycling in Melbourne at their bicycle counters:
And in case you are interested, here are the (small) mode shares of journeys involving bicycle and some other modes (other than walking):
Walking only
Canberra was the only city to have a big increase, while there were declines in Darwin, Perth, Adelaide, Brisbane, and Sydney.
The smaller cities had the highest walking share, perhaps as people are – on average – closer to their workplace, followed by Sydney – the densest city. But city size doesn’t seem to explain cycling mode shares.
Car
The following chart shows the proportion of journeys to work made by car only (either as driver or passenger):
Sydney has the lowest car only mode share and it declined again in 2016. It was followed by Melbourne in 2016. Brisbane and Perth had large increases in car mode share in 2016 (in line with the PT decline mentioned above). Darwin also shows a big shift away from the car to public transport (although the total number of car trips still increased by 24%). Adelaide hit top spot, followed by Hobart and Perth.
Here is car as driver only:
And here is car as passenger only:
Car as passenger declined in all cities again in 2016, but was more common in the smaller cities, and least common in the bigger cities. I’m not sure why car as passenger declines paused for Perth and Sydney in 2006.
We can calculate an implied notional journey to work car occupancy by comparing car driver only and car passenger only journeys. This is not actual car occupancy, because it excludes people not travelling to work and excludes journeys that involved cars and other modes. However it does provide an indication of trends in car pooling for journeys to work.
There were further significant decreases in car commuter occupancy, in line with increasing car ownership and affordability.
Private transport
Here is a chart summing all modal combinations involving cars (driver or passenger), motorcycle/scooter, taxis, and trucks, but excluding any journeys that also include public transport.
The trends mirror what we have seen above, and are very similar to car-only travel.
Overall mode split
Here’s an overall split of journeys to work by “main mode” (click to enlarge):
Note: the 2001 data includes estimated splits of aggregated modes based on 2006 data.
I assigned a ‘main mode’ based on a hierarchy as follows:
Any journey involving train is counted with the main mode as train
Any other journey involving bus is counted with the main mode as bus
Any other journey involving tram and/or ferry is counted as “tram/ferry”
Any other journey involving car as driver, truck or motorbike/scooter is counted as “vehicle driver”
Any other journey involving car as passenger or taxi is counted as “vehicle passenger”
Any other journey involving walking or cycling only as “active”
How different are “place of work” and “place of enumeration” mode shares?
[this section updated 1 December 2017 with re-issued Place of Work data. See new Appendix 3 below for analysis of the changes]
The first edition of this post reported only “place of work” data, as place of enumeration data wasn’t released until 11 November 2017. This second edition now focuses on place of enumeration – where people were on census night.
The differences are not huge, as most people who live in a city also work in that city, but there are still a number of people who leave or enter cities’ statistical boundaries to go to work. Here’s an animation showing the main mode split by place of work and enumeration so you can compare the differences (you’ll need to click to enlarge). The animation dwells longer on place of work data.
Public + active transport main mode shares are generally higher for larger cities with place of work data, and smaller for smaller cities.
Here’s a closer look at the 2016 public transport mode shares by the two measures:
See also a detailed comparison in Appendix 1 below for 2011 Melbourne data.
I’d like to acknowledge Dr John Stone for assistance with historical journey to work data.
Appendix 1 – How to measure journey to work mode share
Firstly, I exclude people who did not work, worked at home, or did not state how they worked. The first two categories generate no transport activity, and if the actual results for “not stated” were biased in any way we would have no way of knowing how.
I prefer to use “place of enumeration” data (ie where people were on census night). “Place of usual residence” data is also available, but is unfortunately contaminated by people who were away from home on census day. The other data source is “Place of work”.
Some people might prefer to measure mode shares on Urban Centres which excludes rural areas within the larger blobs that are Greater Capital City Statistical Areas and Statistical Divisions (use this ABS map page to compare boundaries). However, “place of work” data is not readily available for that geography, and this method also excludes satellite urban centres that might be detached from the main urban centre, but are very much part of the economic unit of the city.
Another option is “Significant Urban Area”, which includes more fringe areas, and some more satellite towns, and in Canberra’s case crosses the NSW border to capture Queanbeyan.
What difference does it make?
Here’s a comparison of public transport mode shares for the different methods for 2011.
If you look closely, you’ll notice:
The more than you remove non-urban areas, the higher your public transport mode share, which makes sense, as those non-urban areas are mostly not served by public transport.
Place of usual residence tends to increase public transport mode shares for smaller cities (people probably visiting larger cities) and depresses public transport mode share in larger cities (people visiting smaller cities and towns).
Place of work is only readily available for Greater Capital City Statistical Areas. For the bigger cities it tends to inflate PT mode share where people might be using good inter-urban public transport options, or driving to good public transport options on the edges of cities (eg trains). However it has the opposite impact in Darwin and Canberra, where driving into the city is probably easier.
But I think the main point is that for any time series trend analysis you should use the same measure if possible.
If you want to compare the two, I’ve created a Tableau Public visualisation that has a large number of mode shares by both place of work and place of enumeration.
Appendix 2 – Estimating pre-2006 mode shares from aggregated data
For 2006 onwards, ABS TableBuilder provides counts for every possible combination of up to three modes (other than walking, which is assumed to be part of every journey). For example, in Melbourne in 2006, 36 people went to work by taxi, car as driver, and car as passenger (or so they said!). Unfortunately for years before 2006 data is not readily available with a full breakdown.
The 2001 data includes only aggregated counts for the following categories:
train and other (excluding bus)
bus and other (excluding train)
other two modes (no train or bus)
train and two other modes
bus and two other modes (excluding train)
three other modes (no train or bus)
Together these accounted for 3.7% of journeys in Melbourne and 4.5% of journeys in Sydney.
However all but two of those aggregate categories definitely involve train and/or bus, so can be included in public transport mode share calculations.
Journeys in the aggregate categories “Other two modes” and “Other three modes” might involve tram and/or ferry trips (if such modes exist in a city), but we don’t know for sure.
I’ve used the complete modal data for 2006 to calculate the percentage of 2006 journeys that fit into these two categories that are by public transport. I’ve then assumed these same percentage apply in 2001 to estimate total public transport mode shares for 2001 (for want of a better method).
Here are the 2001 relevant stats for each city:
(note: totals do not add perfectly due to rounding)
The estimates add up to 0.2% to the total public transport mode shares in cities with significant modes beyond train and bus (namely ferry and tram in Sydney, tram in Melbourne, ferry in Brisbane, tram and Adelaide). This almost entirely comes from “other two modes” category while “other three modes” is tiny. For these categories, almost no journeys in Perth, Canberra and Hobart actually involved a public transport mode.
In the past I have knowingly ignored public transport journeys that might be part of these categories, which almost certainly means public transport mode share is underestimated (I suspect most other analysts have too). By including some assumed public transport journeys my estimate should be closer to the true value, which I think is better than an underestimate.
But are these reasonable estimates? Are the 2001 modal breakdowns for these categories likely to be the same as 2006? Maybe not exactly, but because we are multiplying small numbers by small numbers, the impact of slightly inaccurate estimates is unlikely to shift the total by more than 0.1%. I tested the methodology between 2006 and 2011 results (eg using 2011 full breakdown against created 2006 aggregate categories and vice versa) and the estimated total mode shares were almost always exactly the same as the perfectly calculated shares (at worst there was a difference of 0.1% when rounding to one decimal place).
In the first edition of this post I had to estimate 2016 place of work mode shares in a similar way for public and private transport, but I wasn’t confident enough to estimate mode share of journeys involving cycling.
I now have the final data and I promised to see how I went, so here’s a comparison:
If you round to one decimal place, the estimates were no different for public and private transport and out by up to 0.1% for cycling (which is relatively significant for the small cycling mode shares).
I’ve applied a similar approach to estimate several other mode share types, and these are marked on charts.
Appendix 3 – How different is the re-issued place of work data?
In December 2017, ABS re-issued Place of Work data due to data quality issues. This is how they described it:
**The place of work data for the 2016 Census has been temporarily removed from the ABS website so an issue can be corrected. There was a discrepancy in the process used to transform detailed workplace location information into data suitable for output. The ABS will release the updated information in TableBuilder on December 2. The Working Population Profiles will be updated on December 13.**
I have loaded the new data, and here are differences in public transport and private transport mode shares for capital cities:
You can see differences of up to 0.3% (Melbourne PT mode share), but mostly quite small.
Over one million private dwellings in Australia were unoccupied on census night in 2016 – 11.2% of all private dwellings – up from 10.2% in 2011.
This raises many questions. Where are these unoccupied dwellings and where are they now more prevalent? What type of dwellings are more likely to be unoccupied? How long have these dwellings been unoccupied? Do we know why these dwellings are unoccupied?
This post will focus on dwelling occupancy by geography, dwelling types and trends over time. In a future post I hope look into those last two questions in more detail.
I’ve prepared data for sixteen Australian cities, with various maps in Tableau (you will need to zoom and pan to your city of interest).
Why am I blogging about dwelling occupancy on a transport blog? Well partly because I’m interested in urban issues, but also because land use is very relevant to transport. If dwelling occupancy rates in the inner and middle suburbs were higher, there would be more people living closer to jobs and activities who might be less reliant on private motorised transport for their daily travel.
If you’d like to read more around the associated policy issues, Professor Hal Pawson from UNSW has a good piece in The Conversation highlighting the increasing number of empty properties and spare bedrooms, and advocates replacing stamp duty with a broad-based land tax to improve housing mobility. Also read Eryk Bagshaw in the Fairfax press, Jonathan Jackson in Finfeed, and a piece in Business Insider where the Commonwealth Bank state that 17% of recently built dwellings are left unoccupied (not sure how that was calculated).
What are the dwelling occupancy rates in Australian cities?
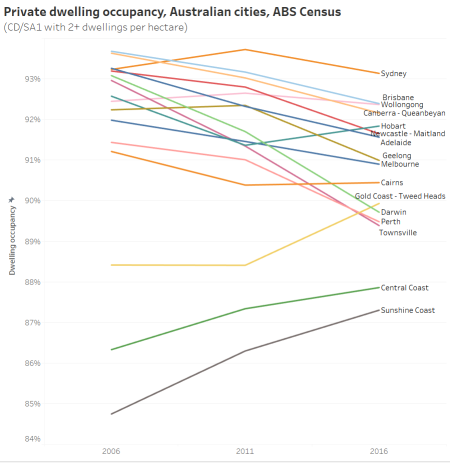
Here’s a chart showing private dwelling occupancy rates for sixteen Australian cities (using 2011 Significant Urban Area boundaries) from the last three censuses:
Note the y-axis only runs from 84% to 94%, so the changes are not massive. However a small change in dwelling occupancy can still have a large impact on housing prices (rental and sales).
The Sunshine and Central Coasts have the lowest occupancy, almost certainly explained by many holiday homes in those regions, although all three have been trending upwards. Curiously, the Gold Coast – Tweed Heads had a significant increase in occupancy between 2011 and 2016 to take it above Perth, Townsville, and Darwin.
Hobart and Cairns also had increased occupancy between 2011 and 2016, but all large cities declined between 2011 and 2016. Perth, Darwin and Townsville had big slides – quite possibly related to the downturn in the mining industry and slowing population growth (all three have seen slowing population growth in recent years after a boom period). Then again, if there are more fly-in-fly-out workers in a city you might expect dwelling occupancy on census night to go down as a portion of them will be away for work on census night.
How does dwelling occupancy in capital cities compare to the rest of the country?
Private dwelling occupancy is significantly lower outside the capital city areas. While the capital city areas contain 63% of all private dwellings, they only contain 51% of unoccupied private dwellings.
How does dwelling occupancy vary by dwelling type?
Here’s a chart of 2016 dwelling occupancy by Greater Capital City Statistical Areas and the most common dwelling types:
In many cities there is a strong correlation between housing type and occupancy, with separate houses having the highest occupancy rates, and multi-storey flats/apartments having the lowest. The pattern is strongest in Perth – perhaps reflecting reduced demand for apartment living following the end of the mining boom(?).
The data suggests higher density apartments are more likely to not be occupied on census night, but it doesn’t tell us why. Of course different dwelling types have different spatial distributions, so is it the dwelling type that drives the occupancy rates? I’ll come back to that shortly.
Where are the unoccupied dwellings?
Quite simply, here is a map showing the density (at SA2 geography) of unoccupied dwellings in Melbourne over time (you might need to click to enlarge to read more clearly):
(I’ve not shaded SA2s with less than 1 unoccupied dwelling per hectare. You can look at other cities in Tableau by zooming out and then in on another city).
You can see a fairly significant increase in the number of unoccupied dwellings in the inner and middle suburbs (at least at densities above 1 per hectare).
From a transport perspective – this isn’t great. If people lived in those dwellings rather than dwellings on the fringe of Melbourne, the transport task would be easier as there would be many more people living closer to jobs and other destinations with non-car modes being more competitive.
But these areas with a relatively high density of unoccupied dwellings are also areas with a high density of dwellings in general. The density of unoccupied dwellings has risen in the same places where total dwelling density has risen:
(see in Tableau – you may need to change the geography type)
Given you would expect a small percentage of dwellings to be unoccupied for good reasons (eg resident temporarily absent, or property on the market), it makes sense that the density of unoccupied dwellings has gone up with total dwelling density.
But a decrease in the dwelling occupancy rate requires the number of unoccupied dwellings to be growing at a faster rate than the total number of dwellings. We already know that is happening at the city level through declining occupancy rates, so how does that look inside cities?
How does dwelling occupancy vary across Melbourne?
Here’s a map of dwelling occupancy in Melbourne and Geelong at CD/SA1 level geography:
You can see very clearly that occupancy is lowest on Mornington Peninsula beaches to the south – which almost certainly reflects empty holiday homes on census night (a Tuesday night in winter).
In fact, I’ve created a map of dwelling occupancy at SA2 level for all of Australia, and you can see many coastal holiday areas around Melbourne (and other cities) with low occupancy (with Lorne – Anglesea at 32% and Phillip Island at 40%):
The previous Melbourne map at CD/SA1 level is very detailed and so it’s not easy to see the overall trends. Also, apart from the Mornington Peninsula, occupancy rates are almost all above 80%.
So here is a zoomed-in map with a different (narrower) colour scale, with data aggregated at SA2 level (also in Tableau):
Things become much clearer.
The highest dwelling occupancy is generally on the fringe of Melbourne.
Apart from holiday home areas, the lowest occupancy in 2016 was concentrated in wealthier inner suburbs, including Toorak at 83% and South Yarra west at 84%. This was closely followed by the CBD, Docklands, East Melbourne, Southbank, and Albert Park between 84% and 86%. These areas have all had declining occupancy since 2011.
It can be a little difficult to see the changes in occupancy rates, so here is a non-animated map the change in dwelling occupancy rates between 2006 and 2016 (also in Tableau):
There are at least small declines in most parts of Melbourne. The biggest decline was 7% in Bundoora North (with lowest 2016 occupancy of 79% in these new units in University Hill ), followed by 5% in Doncaster (lowest around Doncaster Hill where there are new apartments, perhaps too new to be occupied on census night?), 4% in South Yarra East (lowest in the new apartments around South Yarra Station, again possibly because some are very new) and Prahran – Windsor.
Curiously, Docklands dwelling occupancy increased by 9% from 75% to 85% (rounding means that those numbers don’t perfectly add). Perhaps there were many new yet-to-be-occupied dwellings in 2006? For reference, Dockland’s 2011 occupancy was 84%, only slightly below the 2016 level.
The outer growth areas are a mixed bag of increases and decreases. This possibly depends again on how many brand new but not yet occupied dwellings there were in 2006 and 2016.
What are the dwelling occupancy patterns in other cities?
Sydney
You can see lower occupancy around the CBD, North Sydney, Manly, and the northern beaches, and higher occupancy in the western suburbs.
The largest declines are evident in the city centre and North Ryde – East Ryde:
Brisbane
Brisbane has some big declines to the north-east of the city centre, Rochedale – Burbank, Woodridge, Logan, and Leichhardt – One Mile. The Redland Islands in the east are presumably a popular place for holiday homes.
Perth
Low occupancy is evident around Mandurah in the south (a popular holiday home area). Lower occupancy has spread around the inner city, and beach-side suburbs of Scarborough, Cottesloe, Fremantle, and Rockingham (many of which are areas with higher concentrations of Airbnb properties).
The biggest declines were in Maylands, Victoria Park – Lathlain – Burswood, and South Lake – Cockburn Central. For the first two of these areas the decline was mostly in flats/units/apartments.
Adelaide
The lowest occupancy is on the south coast and in Glenelg. The biggest decline was in Fulham (-5%), followed by Payneham – Felixstowe (-4%):
[Canberra, Hobart and Darwin added 6 November 2017]
Canberra
Dwelling occupancy was lowest around Parliament House (the census was not during a sitting week in 2016), and highest in the outer northern and southern suburbs. The 2006 census was during a sitting week, so it’s little surprise that big dwelling occupancy reductions were seen around Capital Hill between 2006 and 2016. There was also a 5% decline in Farrer and a 6% growth in Gungahlin between 2006 and 2016 (Gungahlin’s dwellings almost doubled between 2006 and 2011, so the 2006 result might reflect brand new dwellings awaiting occupants).
Hobart
Dwelling occupancy was lowest in central Hobart, with the biggest decline of 4% in Old Beach – Otago, but overall there was little change between 2006 and 2016 (average occupancy did drop slightly in 2011 though).
Darwin
Darwin dwelling occupancy was lowest in the city centre at 82% in 2016, while Howard Springs had 100% occupancy (in 2016). Declines are evident between 2006 and 2016 across most parts of Darwin.
Gold Coast
Here’s a map of 2016 occupancy at SA1 level, with the original broader colour scale:
You can see quite clearly that the beach-side areas have low occupancy, while the inland areas have much higher occupancy (some at 100%). Presumably many permanent residents cannot or choose not to compete with tourism for beach-side living.
Sunshine Coast
Similar patterns are evident on the Sunshine Coast, particularly around Noosa and Sunshine Beach in the north:
If you want to see other cities, move around Australia in Tableau for occupancy maps at CD/SA1 and SA2 geography (choose you year of interest), and occupancy change maps (at SA2 geography).
So are there lots of unoccupied inner city apartments in Melbourne?
Some commentators have spoken about many inner city apartments being unoccupied – perhaps through a glut or investors chasing capital gains and not interested rental incomes.
Here is dwelling occupancy in central Melbourne at SA1 geography for 2016, using the broader colour scale (also in Tableau):
There are quite a few pockets of very low occupancy, particularly areas shaded in yellows and greens. The average private dwelling occupancy for the City of Melbourne local government area was 87%, lower than the Greater Melbourne average of 91%.
The lowest occupancy is a block between Adderley, Spencer and Dudley Street in North Melbourne at 56%, which is probably related to the recent completion of an apartment tower not long before the census (from Google Street view we know it was under construction in April 2015 and completed by October 2016).
There are several patches of yellow (65-70% occupancy) in the CBD, Docklands and Southbank.
But what about apartment towers? For that we need to drill down to mesh blocks – and thankfully 2016 census data is actually provided at this level.
Here’s a map showing dwelling occupancy of mesh blocks in the City of Melbourne (local government area) with at least 100 dwellings per hectare (as an arbitrary threshold for large apartment building – see the appendix for an example of this density):
Some notable low occupancy apartment towers include:
48% for an apartment tower at 555 Flinders Street (Northbank Place Central Tower) between Spencer and King Street and the railway viaduct. It wasn’t brand new in 2016.
47% in a block that includes the Melbourne ONE apartment tower, possibly because it was only just opened (as I write there are still apartments for sale)
66% for a tower at 28 Southgate Ave (corner City Road), and 67% for the Quay West tower next door (almost certainly popular places for Airbnb / serviced apartments).
Several of these towers include advertised serviced apartments, and I expect the towers would contain a mix of serviced apartments, owner-occupied apartments and rentals (regular and Airbnb). However ABS advises me that field officers do speak to building managers, and are therefore likely to not code serviced apartments as private dwellings.
That said, according to the 2016 census data there were only 11 non-private dwellings in Docklands that were classified as “Hotel, motel, bed and breakfast”, and zero non-private dwellings in the New Quay apartment towers.
I snapped this picture at 9pm on a Sunday in September 2017 of the apartments at New Quay (Docklands) that at the 2016 census had 65-70% occupancy:
Of course you wouldn’t expect lights to be on in all rooms in all occupied dwellings at 9pm on a particular Sunday, but I dare say it’s probably a time when fewer people would be out. It looks like a lot less than a quarter of rooms are lit. I know very few of these are on Airbnb (more on that in a future post!), but I don’t know how many are actually serviced apartments.
There’s huge variation in dwelling occupancy across these mesh blocks. So is the lower occupancy more concentrated in higher density areas? Here’s a scatter plot of all mesh blocks in the City of Melbourne by dwelling density and occupancy:
There’s not a strong relationship between density and occupancy. The variation in dwelling occupancy between mesh blocks will probably depend on a lot of local factors.
What about occupancy by dwelling type for the inner city?
(data points removed where dwelling counts were small, the isolated blue dot at the bottom is for Southbank).
There’s no evidence that flats / apartments have lower occupancy than other housing types in the central city. However there is evidence that inner city areas have relatively lower occupancy.
So how does the occupancy of apartment blocks of 4+ storeys vary across Melbourne?
Box Hill had the lowest apartment occupancy of 50% (perhaps some were brand new?), followed by Ringwood, Glen Waverley, and Brighton in the 70-75% range. Croydon East, Templestowe , Seddon – Kingsville, Clayton, Carnegie, West Footscray, Braybrook and Frankston reported occupancy above 95%. The inner city areas were around 84-85% occupied, and these would make up the majority of such dwellings in Melbourne.
Apartments in blocks of 4+ storeys seem to have lower occupancy on average because most of them are located in the central city, which generally has lower dwelling occupancy.
Here’s a similar map (with a different colour scale) for dwelling occupancy of separate houses across the Melbourne region:
The lowest rates in metropolitan Melbourne are 82-83% in some inner city areas, while the urban growth shows up in pink and purple, mostly 94-96%.
Explore the 2016 occupancy rates at SA2 geography for different dwelling types for any part of Australia in Tableau. You can also view changes in occupancy rates since 2006 for separate houses, flats/units/apartments, and semi-detached/townhouses.
Why are there lower dwelling occupancy rates in the central city?
The census doesn’t answer this, and I’m not a housing expert, but I dare say there are plenty of plausible explanations:
Many dwellings are rented out on Airbnb (and/or other platforms) – but are not in high demand on a weeknight in mid-winter (more on that in a future post).
Many dwellings are serviced apartments that are indistinguishable from regular private dwellings (in buildings with a mixture of dwelling use). ABS say they don’t count these as private dwellings, however they are not showing up as non-private dwellings.
Dwellings are more likely to occupied by executives who travel more frequently.
Dwellings might be second homes for people living outside the city.
Dwellings might be owned by employers for interstate staff visiting Melbourne.
Dwellings might be poorly constructed and uninhabitable (eg mould issues).
Investors who are not interested in rental income might deliberately leave properties vacant (something that is disputed).
But I’m just speculating.
What about dwelling occupancy in the centre of other cities?
Here’s a map of the Sydney CBD area at SA1 geography:
There are some very low occupancy rates in the north end of the CBD, but very high occupancy rates around Darling Harbour and Pyrmont.
Here’s central Brisbane:
Here are occupancy rates for different dwelling types for selected inner city SA2s in Sydney, Brisbane, Adelaide and Perth:
In all SA2s except Surrey Hills (Sydney) and South Brisbane, flats or apartments in 4+ storey blocks had the lowest dwelling occupancy in 2016. Only in Perth City SA2 (which is quite a bit larger than the CBD) is there a reasonably clear relationship between housing type and occupancy.
Summary of findings
Couldn’t be bothered reading all of the above, or forgot what you learnt? Here’s a summary of findings:
Dwelling occupancy, as measured by the census, has declined in most Australian cities between 2006 and 2016 (particularly larger cities).
Dwelling occupancy is generally very low in popular holiday home areas, but also relatively low in central city locations.
Dwelling occupancy is generally highest in outer suburban areas.
Higher density housing types generally have lower occupancy, but that is probably because they are more often found in inner city areas.
There are examples of low occupancy apartment towers in Melbourne, but there’s not a clear relationship between dwelling density and dwelling occupancy in central Melbourne.
In a future post I plan to look more at why properties might be unoccupied, and for how long they are unoccupied, drawing on Airbnb and water usage datasets. I might also look at bedrooms and bedroom occupancy which is a whole other topic.
Appendix – About the census dwelling data
I’ve loaded census data about occupied and unoccupied private dwellings data into Tableau for 2006, 2011, and 2016 censuses for sixteen Australian cities at the CD (2006) / SA1 (2011,2016) level, which the smallest geography available for all censuses. I’ve mapped all these CDs and SA1s to boundaries of 2016 SA2s and 2011 Significant Urban Areas (as per my last post). Those mappings are unfortunately not perfect, particularly for 2006 CDs.
The ABS determine a private dwelling to be occupied if they have information to suggest someone was living in that dwelling on census night (eg a form was returned, or there was some evidence of occupation). Under this definition, unoccupied dwellings include those with usual residents temporarily absent, and those with no usual residents (vacant).
For my detailed maps I’ve only included CDs / SA1s with a density of 2 dwellings per hectare or more.
For reference, here is a Melbourne mesh block with 100 dwellings per hectare:
And here is a mesh block with 206 dwellings per hectare (note only a small part of mesh block footprint contains towers):
While journeys to work only represents around a quarter of all trips in Melbourne, they represent around 39% of trips in the AM peak (source: VISTA 2012-13). Thanks to the census there is incredibly detailed data available about the journey to work, and who doesn’t like exploring transport data in detail?
Between 2006 and 2016, Melbourne has seen mode shifts away from private transport and walking, and towards public transport and cycling. The following measures are by place of enumeration (and 2011 Significant urban area boundaries):
2006
2011
2016
Public transport (any)
14.16%
16.34%
18.15%
+2.18%
+1.82%
Private transport (only)
80.43%
78.16%
76.20%
-2.28%
-1.96%
Walk only
3.63%
3.46%
3.47%
-0.18%
+0.01%
Bicycle only
1.34%
1.56%
1.63%
+0.23%
+0.06%
This post unpacks where mode shifts and trip growth is happening, by home locations, work locations, and home-work pairs. It tries to summarise the spatial distribution of journeys to work in Melbourne. It will also look at the relationship between car parking, job density and mode shares.
I’m afraid this isn’t a short post. So get comfortable, there is much fascinating data to explore about commuting in Melbourne.
Public transport share by home location
Here’s an animated public transport mode share map 2006 to 2016 – you might want to click to enlarge, or view this map in Tableau (be patient it can take some time to load and refresh). For those with some colour-blindness, you can also get colour-blind friendly colour scales in Tableau.
The higher mode shares pretty clearly follow the train lines and the areas covered by trams, with mode share growing around these lines. Public transport mode shares of over 50% can be found in a sizeable patch of Footscray, and pockets of West Footscray, Glenroy, Ormond – Glen Huntly, Murrumbeena, Flemington, Docklands, Carlton, and South Yarra. Larger urban areas with very low public transport mode share can be found around the outer east and south-east of the city, particularly those remote from the rail network.
The biggest shifts to public transport in the middle and outer suburbs were in Wyndham Vale, Tarneit, South Morang, Lynbrook/Lyndhurst, Point Cook South, Williams Landing, Rockbank, and Glenroy. That’s almost a roll call of all the new train stations opened between 2011 and 2016. The exceptions are Rockbank (a small community at present which received significantly more frequent trains in 2015), Point Cook South (which now has buses operating every 11 minutes in the AM peak to nearby Williams Landing Station), and Glenroy (where more people are commuting to the city centre and increasingly by public transport).
Inner suburban areas with high mode shifts include West Footscray, Yarraville, Seddon – Kingsville, Collingwood, Kensington, and Brighton. The Melbourne CBD itself had a 12% shift to public transport – and actually a 7% mode shift away from walking (which probably reflects the new Free Tram Zone in the CBD area).
The biggest mode shifts away from public transport (of 1 to 2%) were at Ardeer – Albion, St Kilda East, Malvern Glen Iris, Chelsea – Bonbeach, Seaford, Dandenong, Hampton Park – Lynbrook, Lysterfield, and Monbulk – Silvan. At the 2016 census there were no express trains operating on the Frankston railway line due to level crossing removal works, which might have slightly impacted public transport demand in Seaford and Chelsea – Bonbeach. I’m not sure of explanations for the others, but these were not large mode shifts.
Public transport mode share by work location
Here’s a map showing work location public transport mode share (Destination Zones with less than 5 travellers per hectare not shown):
It’s no surprise that public transport mode share is highest in the CBD and surrounding area, and lower in the suburbs. But note the scale – public transport mode share falls away extremely quickly as you move away from the city centre.
Private transport mode shares are very high in the middle and outer suburbs:
Large areas of Melbourne have near saturation private transport mode share. In most suburban areas employee parking is likely to be free and public transport would struggle to compete with car travel times, even on congested roads (particularly for buses that are also on those congested roads).
There are some isolated pockets of relatively high public transport mode share in the suburbs, including
34% in a pocket of Caulfield – North (right next to Caulfield Station),
33% in a pocket of Footscray (includes the site of the new State Trustees office tower near the station),
And here’s a map showing the mode shift between 2011 and 2016 by workplace location:
The biggest shifts to public transport were in the inner city. The biggest shift away from public transport was Altona Meadows (but volumes were tiny – 73 journeys went down to 51).
Here’s a closer look at the inner city:
Docklands had the highest mode shift to public transport of 8.8% (almost all of it involving train) followed by Collingwood with 7.0% and Parkville with 6.1%.
North Melbourne saw a decline of 1.5% – at the same time private transport mode share and active (only) mode shares increased by 1%. Brunswick West saw a 2.3% decline in public transport mode share, a 1.2% increase in active transport and a 3.4% increase in private transport share.
Another way to slice this data is by distance from the CBD. Here are main mode shares by workplace distance from the centre, over time:
For this and several upcoming pieces of analysis, I have aggregated journeys into three “main mode” categories:
Public transport (any trip involving public transport)
Private transport (any journey involving private transport that doesn’t also involve public transport)
Active transport only (walking or cycling)
Here are the mode shifts by workplace distance from the centre between 2006 and 2016:
The biggest mode shift from private to public transport was for distances of 1-2km from the city centre, which includes Docklands, East Melbourne, most of Southbank, and southern Carlton and Parkville (see here for a reference map). A mode shift to public transport (on average) was seen for workplaces up to 40km from the city centre. The biggest mode shift to active transport was for jobs 2-4 km from the city centre (but do keep in mind that weather can impact active transport mode shares on census day).
What about job density?
Up until now I’ve been looking at mode shifts by geography – but the zones can have very different numbers of commuters. What matters more is the overall change in volumes for different modes. A big mode shift for a small number of journeys can be a smaller trip count than a small mode shift on a large number of journeys.
Firstly, here’s a map of jobs per hectare in Melbourne (well, jobs where someone travelled on census day and stated their mode, so slight underestimates of total employment density):
Outside the city centre, relatively high job density destination zones include:
Heidelberg (Austin/Mercy hospitals with 10.2% PT mode share),
Monash Medical Centre in Clayton (8.3% PT mode share),
Northern Hospital (3.8% PT mode share),
Victoria University Footscray Park campus (21.1% PT mode share),
Swinburne University Hawthorn (39.8% PT mode share),
a pocket of Box Hill (19.9% PT mode share),
a zone including the Coles head office in Tooronga (11.2% PT mode share),
an area near Camberwell station (26.8% PT mode share),
a pocket of Richmond on Church Street (27.8% PT mode share), and
a pocket of Richmond containing the Epworth Hospital (39.5% PT mode share).
You’ll probably not be very surprised to see that there is a very strong negative correlation between job density and private transport mode share. The following chart shows the relationship between the two for each Melbourne SA2 with the thin end of each “worm” being 2006 and the thick end 2016 (note: the job density scale is exponential):
Correlation of course is not necessarily causation – high job density doesn’t automatically trigger improved public and active transport options. But parking is likely to be more expensive and/or less plentiful in areas with high employment density, and many employers will be attracted to locations with good public transport access so they can tap into larger labour pools.
The Melbourne CBD SA2 is at the bottom right corner of the chart, if you were wondering.
The Port Melbourne Industrial and Clayton SA2s are relatively high density employment areas with around 90% private transport mode shares.
Here’s a zoom in on the “middle” of the above chart, with added colour and labels to help distinguish the lines:
Not only is there a strong (negative) relationship between job density and private transport mode share, most of these SA2s are moving down and to the right on the chart (with the exception of North Melbourne which saw only small change between 2011 and 2016). However the correlation probably reflects many new jobs being created in areas with good public and active transport access, particularly as Melbourne grows its knowledge economy and employers want access to a wide labour market.
How does private transport mode share relate to car parking provision?
Do more people drive to work if parking is more plentiful where they work?
Thanks to the City of Melbourne’s Census of Land Use and Employment, I can create a chart showing the number of non-residential off-street car parks per 100 employees in the City of Melbourne (which I will refer to as “parking provision” as shorthand):
Car parking provision per employee has increased in Carlton, North Melbourne and Port Melbourne and decreased in Docklands, West Melbourne (industrial), and Southbank. Docklands had the highest car parking provision in 2002 but this has fallen dramatically and land has been developed for employment usage. Southbank, which borders the CBD, has relatively high car park provisioning – much higher than Docklands and East Melbourne.
Here’s the relationship between parking provision and journey to work private transport mode share between 2006 and 2016:
It’s little surprise to see a strong relationship between the two, although Carlton is seeing increasing parking provision but decreasing private transport mode share (maybe those car parks aren’t priced for commuters?). North Melbourne increased on both measures between 2011 and 2016.
If all non-resident off street car parks were used by commuters, then you would expect the private transport mode share to be the same as the car parks per employee ratio.
Private transport mode shares were much the same as parking provision rates in Melbourne CBD, Docklands, and Southbank, suggesting most non-residential car parks are being used by commuters (with the market finding the right price to fill the car parks?). Private transport mode share was higher than car parking provision in East Melbourne, Parkville, South Yarra, North Melbourne, and West Melbourne (industrial). This might be to do with on-street parking and/or more re-use of car parks by shift workers (eg hospital workers).
Port Melbourne parking provision is very high (there is also lots of on-street parking). It’s possible some people park in Port Melbourne and walk across Lorimer Street (the CLUE border) to work in “Docklands” (which includes a significant area just north of Lorimer Street). It’s also likely that many parking spaces are reserved for visitors to businesses. Carlton similarly had higher parking provision than private transport mode share (again, could be priced for visitors).
(Data notes: For 2011, I have taken the average of 2010 and 2012 data as CLUE is conducted every even year. I’ve done a best fit of destinations zones to CLUE areas, which is not always a perfect match)
Where are the new jobs and how did people get to them?
Here’s a map showing the relative number of new jobs per workplace SA2, and the main mode used to reach them:
The biggest growth in jobs was in the CBD, followed by Docklands, and then Dandenong in the south-east.
The CBD added 33,210 jobs, and almost all of those were accounted for by public transport journeys, although 2,750 were by active transport, and only 867 new jobs by private transport (3%).
Likewise most of the growth in Docklands and Southbank was by public transport, and then in several inner suburbs private transport was a minority a new trips.
However, Southbank still has a relatively high private transport mode share of 44.5% for an area so close to the CBD. The earlier car parking chart showed that Southbank has about one off-street non-residential car park for every two employees. These include over 5000 car parks at the Crown complex alone (with $16 all day commuter parking available as at November 2017). It stands to reason that the high car parking provision could significantly contribute to the relatively high private transport mode share, which is in turn generating large volumes of radial car traffic to the city centre on congested roads. Planning authorities might want to consider this when reviewing applications for new non-residential car parks in Southbank.
Here’s a chart look looking at commuter volumes changes by workplace distance from the CBD (see here for a map of the bands).
(Note: the X-axis is quasi-exponential)
Public transport dominated new journeys to work up to 2km from the city centre and only just outnumbered private transport between 2 and 4 km. Private transport dominated new journeys to workplaces more than 4km from the city centre – however that doesn’t necessarily mean a mode shift away from public transport if the new trips have a higher public transport mode share than the 2011 trips. Indeed there was a mode shift towards public transport for workplaces in most parts of Melbourne.
Here is a map showing the private transport mode share of net new journeys to work by place of work:
Private transport had the lowest mode share of new jobs in the inner city. As seen on the map, some relative anomalies for their distance from the CBD include Hampton (70%), Brunswick East (40%), and Albert Park (24%). Explore the data in Tableau.
Where did the new commuters come from and what mode did they use?
Here’s a map showing the (relative) net volume change of private transport journeys to work, by home location:
As you can see many of the new private transport journeys to work commenced in the growth areas, although there were also some substantial numbers from inner suburbs such as South Yarra, Richmond, Braybrook, Maribyrnong and Abbotsford.
There are many middle suburban SA2s with declines. These are also suburbs where there has been population decline – which I suspect are seeing empty nesting (adult children moving out) and people retiring from work. For example Templestowe generated 561 fewer private transport trips, 48 fewer active transport only trips, but only 50 new public transport trips.
Here’s a similar map showing change in public transport journeys:
The biggest increases were from the inner city, with the CBD itself generating the largest number of new public transport trips (including almost 2500 journeys involving tram). However there were a number of new public transport trips from the Wyndham area in the south-west (where new train stations opened).
Here’s a map of the total new trip volume and main mode split:
You can see that private transport dominates new journeys from the outer suburbs, but less so in the south-west where a new train line was opened. The middle and inner suburbs are hard to see on that map, so here is a zoomed in version:
You can see many areas where private transport accounted for a minority of new trips.
Here’s how it looks by distance from the city centre:
Public transport dominated new journeys to work for home locations up until 10km from the city centre, was roughly even with private transport from 10km to 20km (hence a net mode shift to public transport). However private transport dominated new commuter journeys beyond 20km – most of which is from urban growth areas. The 24-30 km band covers most of the western and northern growth areas, while the 40km+ band is almost entirely the south-east growth areas.
Here is a view of the private transport mode share of net new trips:
(explore in Tableau)
The pink areas had a net decline in the number of private transport trips (or total trips) generated, so calculating a mode share doesn’t make a lot of sense. There are some areas with 100%+ which means more new private transport trips were generated than total new trips – ie active and/or public transport trips declined.
You can again see that private transport dominated new trips in the most outer suburbs, with notable exceptions in the west:
Wyndham in the south-west where two new train stations opened. 38% of new trips from Wyndham Vale and 30% of new trips from Tarneit were by public transport.
Sunbury in the north-west, to which the Metro train network was extended in 2012. Around 28% of new trips from Sunbury were by public transport (that’s 329 trips).
How has the distribution of home and work locations in Melbourne changed by distance from the city?
Here’s a chart showing the number of journey to work origins and destinations by distance from the city centre by year. Note the distance intervals are not even, so look for the vertical differences in this chart:
You can see most of the worker population growth (origins) has been in the outer suburbs. The destination (job) growth was much more concentrated in the inner city between 2006 and 2011, but then more evenly distributed across the city in 2016.
The median distance of commuter home locations from the city centre increased from 18.2 km in 2006 to 18.6 km in 2016. The median distance from the city centre of commuter workplaces decreased from 13.3 km in 2006 to 12.8 km in 2011 but then increased back to 13.3 km in 2016.
Here’s another way at looking at the task. I’ve split Melbourne by SA2 distance from the CBD (to create 10km wide rings) for home and work locations (and further split out the CBD as a place of work) to create a matrix. Within each cell of the matrix is a pie chart – the size of which represents the relative number of commuter trips between that home and work ring, and the colours showing the main mode. I’ve then animated it over 2011 and 2016 (to make it five dimensional!).
I think this chart fairly neatly summarises journeys to work in Melbourne:
Private transport dominates all journeys that stay more than 5km from the city centre (all but top left corner)
Active transport is only significant for commuters who work and live in the same ring (diagonal top left – bottom right), or for trips entirely within 15 km of the centre (six cells in top left corner)
Public transport dominates journeys to the CBD, no matter how far away people’s homes are, but the number of such journeys falls away rapidly with home distance from the CBD. Very few people commute from the outer suburbs to the CBD.
Private transport commuters are mostly travelling between middle suburbs, not to the CBD or even the to within 5 km of the city. However on average they are travelling towards the centre. This will become clearer shortly.
Public transport otherwise only gets 15% or better mode share for trips to within 5 km of the centre or the relatively small number of outward trips from the inner 5km.
Here’s a look at the absolute change in number of trips between the rings:
You can see:
A significant growth in private transport trips, particularly within 5 – 25 km from the CBD.
A significant growth in public transport trips, mostly to the CBD and areas within 5 km from the CBD.
Where are commuters headed on different modes?
This next analysis looks at the distribution of origins and destinations for people using particular modes, which can be compared to all journeys.
The next chart looks at the distributions of work destinations by main mode for each census year (using a higher resolution set of distances from the CBD).
On the far right is the distribution of jobs across Melbourne (with roughly equal numbers in each distance interval), and then to the left you can see the distribution of workplace locations for people who used particular modes. You can see how different modes are more prominent in different parts of the city.
You might need to click to enlarge to read the detail.
In 2016, trips to within 2km of the city centre accounted for 19% of all journeys, but 62% of public transport journeys, 31% of walking journeys, and only 7% of private transport only journeys.
Train, tram, and bicycle journeys are biased towards the inner city, while private transport only journeys are biased to the outer suburbs. Walking and bus journeys are only slightly biased towards the inner city. This should come as no surprise given the maps above showing high public transport mode shares in the inner city and very high private transport mode shares in most of the rest of the city.
Over time, public transport journeys to work became less likely to be to the central city as public transport gained more trips to the suburbs. However bus journeys to work became more likely to be in the city centre (this probably reflects the significant upgrades in bus services between the Doncaster area and city centre).
Notes on the data:
Unless a mode is labelled “only”, then I’ve counted journeys that involved that mode (and possibly other modes).
Sorry I don’t have public transport mode specific data for 2006 so there are some blank columns.
Where do commuters using different modes live?
Here’s the same breakdown, but by home distance from the city centre:
Private transport commuters were slightly more likely to come from the middle and outer suburbs. Tram and bicycle commuters were much more likely to come from the inner city. Bus commuters were over-represented in the 15-25 km band – probably dominated by the Doncaster area. Train commuters were over-represented in distances 5-25 km from the city, and under-represented in distances 35 km and beyond. Journeys by both public and private transport were more likely to come from the middle suburbs.
51% of people walking to work live within 5 km of the city centre, and the growth in walking journeys to work has been much stronger in the inner city.
Here’s a chart showing the most common home-work pairs for distance rings from the CBD for public transport journeys. It’s like a pie chart, but rectangular, larger and much easier to label (I haven’t labelled the small boxes in the bottom right hand corner):
You can see the most common combination is from 5-15 kms to 0-5 kms. This is followed by 15-25 to 0-5 kms and 0-5 to 0-5 kms.
Here’s the same for private transport only journeys:
There is a much more even distribution.
Finally, here is the same for active-only journeys to work:
This is much more polarised, with almost 40% of active transport trips being entirely within 5 km of the city centre. The second most common journey is within 5-15km of the city followed by from 5-15 km to 0-5 km.
In future posts I will look at more specific mode shares and shifts in more detail, the relationship between motor vehicle ownership and journey to work mode shares, and much more!
I hope you have found this analysis at least half as interesting as I have.
(note: this post uses data re-issued in December 2017 after ABS pulled the original Place of Work data in November 2017 due to quality concerns)
My last post looked at the overall trends in journeys to work in Melbourne, with a focus on public and private transport at the aggregate level. This post dives down to look at particular modes or modal combinations, including mode shares, mode shifts and the origins and destinations of new trips.
Train
Here’s mode share for journeys involving train by home location (journeys may also include other modes):
The highest train mode shares can be seen mostly along the train lines, which will surprise no one.
In fact, we can measure what proportion of train commuters live close to train stations. The following chart looks at how far commuters live from train stations, for commuters who use only trains, used trains and possible other modes, and for all commuters.
This chart shows that almost 60% of people who only used train (and walking) to get to work lived within 1 km of a station, and almost three-quarters were within 1.5 km. But around 8% of people only reporting train in their journey to work were more than 3 km from a train station. That’s either a long walk, or people forgot to mention the other modes they used (a common problem it seems).
For journeys involving train, 50% were from within 1 km of a station, but around a quarter were from more than 2 km from a station.
Interestingly, around a third of all Melbourne commuters lived within 1 km of a train station, but a majority of them did not actually report train as part of their journey to work.
So where were the mode shifts to and from train (by home location)?
There were big mode shifts to train around new stations including Wyndham Vale, Tarneit, Lynbrook, South Morang, and Williams Landing. Other bigger shifts were in West Footscray – Tottenham, South Yarra – East, Brighton, Viewbank – Yallambie, Yarrville, Footscray, Kensington, and Flemington (some of which might be gentrification leading to more central city workers?).
There was also a big shift to trains in Point Cook – South, which doesn’t have a train station, but is down the road from the new Williams Landing Station. Almost 28% of commuters from Point Cook South work in the Melbourne CBD, Docklands or Southbank, and most of those journeys were by public transport.
We can also look at mode shares by work location. Here is train mode share by workplace location for 2011 and 2016 (I’ve zoomed into inner Melbourne as the mode shares are negligible elsewhere, and I do not have equivalent data for 2006 sorry):
The highest shares are in the CBD, Docklands and East Melbourne. Notable relatively high suburban shares include the pocket of Footscray containing State Trustees office tower (30.7% in 2016), a pocket of Caulfield including a Monash University campus (29.5%), Box Hill (up to 19.6%), Swinburne University in Hawthorn (37.4%), and 17.5% in a pocket of Yarraville.
The biggest workplace mode shifts to train were in Docklands (+8.6%), Southbank (+5.5%), Abbotsford (+5.5%), Richmond (+5.3%), Collingwood (+5.1%), Parkville (+4.9%), and South Yarra – East (+4.8%).
Bus
Across Melbourne, bus mode share had a significant rise from 2.6% in 2006 to 3.3% in 2011, and then a small rise to 3.4% in 2016. Here’s how it looks spatially for any journey involving bus:
The highest bus mode shares are in the Kew-Doncaster corridor, around Clayton (Monash University), in the Footscray – Sunshine corridor, a pocket of Heidelberg West, around Box Hill and in Altona North. These are areas of Melbourne with higher bus service levels (and most lack train and tram services).
Here’s a map showing mode shift 2011 to 2016 at the SA2 level:
Outside the Kew – Doncaster corridor there were small mode shifts in pockets that received bus network upgrades between 2011 and 2016, including Point Cook, Craigieburn, Epping – West, Mernda, Port Melbourne, and Cairnlea.
There was also a shift to buses in Ormond – Glenhuntly, which can be largely explained by Bentleigh and Ormond Stations being closed on census day due to level crossing removal works, with substitute buses operating.
There were larger declines in Laverton / Williams Landing (where a new train station opened), Footscray, and Abbotsford.
In terms of workplaces, Westfield Doncaster topped Melbourne with 14.4% of journeys involving bus, followed by Monash University Clayton with 12.8% (remember this figure does not include students who didn’t also work at the university on census day), 13.3% at Northland Shopping Centre, and 12.3% in a pocket of Box Hill.
SmartBus
“SmartBus” services operate from 5 am to midnight weekdays, 6 am to midnight Saturdays, and 7 am to 9 pm Sundays, with services every 15 minutes or better on weekdays from 6:30 am to 9 pm, and half-hourly or better services at other times. These are relatively high service levels by Melbourne standards.
SmartBus includes four routes that connect the city to the Manningham/Doncaster region via the Eastern Freeway, three orbital routes, and a couple of other routes in the middle south-eastern suburbs. All routes are relatively direct and none are particularly short. Seven of these routes serve the Manningham region.
To assist analysis, I’ve created a “SmartBus zone” which includes all SA1 and CD areas which have a centroid within 600 m of a SmartBus route numbered 900-908. These routes were all introduced between 2006 and 2011, generally replacing existing routes that operated at lower service levels (I’ve excluded SmartBus route 703 because it was not significant upgraded between 2006 and 2016).
Here are mode shares inside and outside the SmartBus zone:
In 2006 the SmartBus zone already had double the bus mode share of the rest of Melbourne, as existing routes had relatively good service levels, including Eastern Freeway services. Following SmartBus (and other bus) upgrades between 2006 and 2011, there was a 2.5% mode shift to bus in the SmartBus zone, and a 1.3% mode shift to bus elsewhere. The SmartBus zone had a further 0.5% shift between 2011 and 2016 while the shift was only 0.2% in the rest of Melbourne.
Here’s an animated look at bus mode shares for just the SmartBus zone.
You can see plenty of mode shift in the Manningham area (where many SmartBus routes overlap), but also some mode shifts along the others routes – particularly in the south-east.
Notes:
the SmartBus zone includes overlaps with some other high service bus routes – those pockets generally had higher starting mode shares in 2006.
The orbital SmartBus routes do overlap with trains and/or trams which provide radial public transport at high service levels, negating the need or bus as a rail feeder mode (still useful for cross-town travel).
I haven’t excluded sections of SmartBus freeway running from the SmartBus zone. Sorry, I know that’s not perfect analysis, particularly along the Eastern Freeway.
Train + bus
Journeys involving train and bus rose from 1.1% in 2006 to 1.5% in 2011 and 1.7% in 2016, which is fairly large growth off a small base and represents around half of all journeys involving bus. I suspect there might be some under-reporting of bus in actual bus-train journeys, as we saw many people a long way from train stations only reporting train as their travel mode.
Here’s a map showing train + bus mode share at SA2 level. Note the colour scale is in half-percent increments:
Large increases are evident around the middle eastern suburbs (particularly around SmartBus routes), the Footscray-Sunshine corridor (which have frequent bus services running to frequent trains at Footscray Station), Point Cook (where relatively frequent bus routes feeding Williams Landing Station were introduced in 2013, resulting in 750 train+bus journeys in 2016), Craigieburn (again bus service upgrades with strong train connectivity), and Wollert (likewise).
Ormond – Glen Huntly shows up in 2016 because of the rail replacement bus services at Bentleigh and Ormond Stations at the time (as previously mentioned).
Tram
Here’s a map of tram mode shares, overlaid on the 2016 tram network (there haven’t been any significant tram extensions since 2005).
Higher tram mode shares closely follow the tracks, with the highest shares in Brunswick, North Fitzroy, St Kilda, Richmond, and Docklands.
It’s also interesting to note that several outer extremities of the tram network have quite low tram mode shares – including East Brighton, Vermont South, Box Hill, Camberwell / Glen Iris (where the Alamein line crosses tram 75), Carnegie, and to a lesser extent Airport West and Bundoora. These areas have overlapping train services and/or are a long travel time from the CBD.
Overall tram mode share increased from 4.0% in 2006 to 4.6% in 2011 and 4.8% in 2016. Here’s a map of tram mode shift 2011 to 2016 by home SA2:
The biggest mode shift was +12.6% in Docklands, followed by +9.5% in the CBD. This no doubt reflects the introduction of the free tram zone across these areas. Walk-only journey to work mode share fell 4.4% in Docklands and 7% in the CBD.
Abbotsford had a 8.5% mode shift to trams, which possibly reflects the extension of route 12 to Victoria Gardens, providing significantly more capacity along Victoria Street (the only tram corridor serving Abbotsford).
There were small mode share declines in many suburbs, although this does not necessarily mean a reduction in the number of journeys by tram.
Here are tram mode shares by workplace for 2011 and 2016:
The highest workplace tram mode shares were in the CBD, along St Kilda Road south of the CBD, Carlton, Fitzroy, Parkville, Albert Park, South Melbourne, and St Kilda.
Cycling
Cycling mode share increased from 1.5% in 2006 to 1.8% in 2011 and 1.9% in 2016. These are low numbers, but the bicycle mode share was anything but uniform across Melbourne.
Firstly here’s a map of cycling mode share by home location:
There’s not much action outside the inner city, so let’s zoom in:
The highest mode shares are in the inner northern suburbs (pockets around 25%) where there has been considerable investment in cycling infrastructure.
Here’s a chart showing the mode shift at SA2 level:
The biggest mode shift was 2.2% in Brunswick West, followed by 2.1% in South Yarra West. However aggregating to SA2 level hides some of the other changes. If you study the detailed map you can see larger mode shifts in more isolated pockets and/or corridors (including a corridor out through Footscray).
Here is the growth in bicycle trips between 2011 and 2016 by home distance from the city centre:
Significant growth was only seen for homes within 10km of the city centre. Here are those new trips mapped:
What about cycling mode shares by workplaces? I’ve gone straight to the inner city so you can see the interesting detail:
The highest workplace mode shares are in the inner northern suburbs, including Parkville (9.1%) and Fitzroy North (8.2%).
You’ll note the CBD does not have a high cycling mode share (3.8%) compared to the inner northern suburbs. But if you look at the concentration of cycling commuter workplaces, you get quite a different story:
This shows the CBD having the highest concentrations of commuter cycling destinations, although there were also relatively high densities at the Parkville hospitals and the Alfred Hospital. The highest concentration of commuter cyclists in 2016 was a block bound by Lonsdale Street, Exhibition Street, Little Lonsdale Street and Spring Street (it had a mode share of 4.3%).
However if you look at the increase in bicycle commuter trips between 2011 and 2016 by workplace distance from the city, the biggest growth was for destinations 1-4 km from the city centre:
Note: I am using a different scale for charts by workplace distance from the CBD.
How has walking changed?
Overall walking-only mode share in Melbourne as measured by the census has hardly changed, from 3.6% in 2006 to 3.5% in both 2011 and 2016. However there are huge spatial variations.
Here’s walking by home location:
The highest walking mode shares are around the central city with mode shares above 40% in parts of the CBD, Southbank, Carlton, Docklands, North Melbourne, and Parkville. Outside the city centre relatively high mode shares are seen around Monash University Clayton, the Police Academy in Glen Waverley, Box Hill, and Swinburne University in Hawthorn. Walking-only trips are very rare in most other parts of the city.
Here are walking mode shares by workplace location:
The highest walking shares by SA2 in 2016 were in St Kilda East, Prahran – Windsor, South Yarra, Carlton, Carlton North, Fitzroy, and Elwood. There were also smaller pockets of high walking mode share in Yarraville, Footscray, Flemington, Northcote, Ormond – Glenhuntly, Richmond, and Box Hill.
The biggest mode shifts away from walking were in the CBD (-7.3%) and Docklands (-4.0%), which also had big shifts to tram – probably due to the new Free Tram Zone.
Overall, the biggest increase in walking journeys was seen within 5km of the city centre:
For workplaces, the biggest growth in walking was to jobs between 2-4 km from the CBD (be aware of different X-axis scales):
Most common non-car mode
Here is a map showing the most common non-car mode in 2016*. Note the most common non-car mode might still have a very small mode share so interpret this map with caution.
*actually, I’ve not checked motorbike/scooter, taxi, or truck on the basis they are very unlikely to be the most common.
Train dominates most parts of Melbourne, with notable exceptions of the Manningham region (served by buses but not trains), several tram corridors that are remote from trains, and walking around the city centre.
The southern Mornington Peninsula is a mix of bus and walking, plus some SA1s where no one travelled to work by train, tram, bus, ferry, bicycle, or walking-only!
The next map zooms into the inner suburbs, showing the tram network underneath:
Generally tram is only the dominant mode in corridors where trains do no overlap (we saw lower tram mode shares in these areas above). In most of the inner south-eastern suburbs served by trams and trains, train is the dominant non-car mode.
If you look carefully, there are a few SA1s where bicycle is the dominant non-car mode.
In case you are wondering, there are places in Melbourne where train, tram, or walking-only trumped car-only as the most common mode. They are all on this map:
Mode with the most growth
Finally, another way to look at the data is the mode with the highest growth in trips.
Here is a map showing the mode (out of car, train, tram, bus, ferry, bicycle, walk-only) that had the biggest increase in number of trips between 2011 and 2016, by SA2:
Car trips dominated new trips in most outer suburbs (particularly in the south-east), but certainly not all of Melbourne. Train was most common in many middle suburbs (and even some outer suburbs).
Bicycle was the most common new journey mode in Albert Park (+69 journeys), South Yarra – West (+58), Carlton North – Princes Hill (+65), Fitzroy North (+150) and Brunswick West (+165).
Walking led Southbank (+1292 journeys), Fitzroy (+136), and Keilor Downs (+13 with most other modes in small decline, so don’t get too excited).
Bus topped SA2s in the Doncaster corridor, but also Port Melbourne (+187), Wantirna (+16), Kings Park (+11) and Ormond – Glen Huntly (+284 with rail replacement buses operating on census day in 2016).
Tram topped several inner SA2s but also Vermont South (+37).
Want to explore the data in Tableau?
I’ve built visualisations in Tableau Public where you can choose your mode of interest, year(s) of interest, and zoom into whatever geography you like.
The Australian census provides incredibly rich data about journeys to work, with every journey classified by origin, destination, and mode(s) of transport. So you can ask questions such as “where did workers living in X commute to and how many used public transport?” or “where did workers in Y commute from and what percentage used private transport?”, or “What percentage of people in each home location work in the central city?”.
It’s very possible to answer these questions with census data, but near-impossible to produce an atlas of maps that would answer most questions.
But thanks to new data visualisation platforms, it’s now possible to build interactive tools that allow exploration of the data. I’ve built one in Tableau Public, using both 2011 and 2016 census data for all of Australia at the SA2 geography level (SA2s are roughly suburb sized). This means you can look at each census year, as well and the changes between 2011 and 2016.
I’m going to talk through what I’ve built with plenty of interesting examples from my home city Melbourne.
I hope you find exploring the data as fascinating and useful as I do. I also hope this tool makes it easier to inform transport discussions with evidence.
Also, a warning that this is a longer post, so get comfortable.
About the data (boring but important)
The census asks people which modes they used in the journey to work, and the data is encoded for up to three modes.
I’ve extracted a count of the number of trips between all SA2s within each state, by “main mode” for both 2011 and 2016. I’ve aggregated all responses into one of the following “main mode” categories:
Private (motorised) transport only – any journey involving car, truck, motorbike or taxi, but no modes of public transport, or people who only responded with “other”. Around 89% of journeys in this category were simply “car as driver”.
Walking/cycling only (or “active transport”) – journeys by walking or cycling only.
Public transport – any journey involving any public transport mode (train, tram, bus, and/or ferry). These journeys might also involve private motorised transport and/or cycling.
There are 466,597 rows of data all up – so you will need to be a little patient while Tableau prepares charts for you.
Things to note:
I’ve had to extract each state separately to stop the number of possible origin-destination combinations getting too large. This means that interstate journeys to work are not included in the data. I have however combined New South Wales (NSW) and the small Australian Capital Territory (ACT), as many people commute between Queanbeyan (NSW) and Canberra (ACT). Apologies to other areas near state borders!
When you ask the ABS for the number of people meeting certain criteria, the answer will never be 1 or 2. The ABS randomly adjust small numbers to protect privacy, and it’s not a good idea to add up lots of small randomly adjusted figures. That’s another reason why I haven’t gone smaller than SA2 geography and why I’ve aggregated mode combinations to just three modal categories. You will still see counts of 3 or 4, which need to be treated with caution.
Not all SA2s are the same size in terms of residential population, and particularly in terms of working population. The biggest source of commuters for a work area might simply be an SA2 with a larger total residential population.
The ABS change the SA2 boundaries between censuses. With each census some SA2s are split into smaller SA2s, particularly in fast growing areas. If you want to compare 2011 and 2016 figures, it is necessary to aggregate the 2016 data to 2011 boundaries, which the tool does where required. Some visualisation pages will give you the option of aggregating 2016 data to 2011 boundaries to make it easier to compare 2011 and 2016 data.
I’ve only counted journeys where the origin, destination and mode are known. Anyone who didn’t go to work on census day, didn’t state their mode(s) of travel, or didn’t state a fixed land-based work location are excluded.
Assigning “other” only trips as private transport might not be perfect, as it might include non-motorised modes like skateboards and foot scooters. It will also count air travel, and it’s arguable whether that is private or public transport (it’s certainly not low-carbon transport). However, overall numbers are quite small – 0.81% of all journeys with a stated mode in Australia.
Mode share maps to/from a location
First up, you can produce maps showing the main mode share of commuters from all home SA2 for a particular work SA2, or all workplaces for a particular home SA2.
Here is a map of private transport mode shares for journeys to work from Point Cook North:
Private transport dominates most middle and outer work destinations (even local trips), with many at 100%. Lower shares are evident for central city destinations, although Southbank next to the CBD is relatively high at 65%, and 100% of commuters who travelled to Fishermans Bend did so by private transport.
There was a low private transport mode share from the city centre and Brunswick to the north, roughly 40-50% mode shares from the south-eastern suburbs (accessible by train), but very high mode shares from the middle and outer suburbs to the north and west (public transport access more difficult). The new Metro Tunnel could make a dent in these mode shares, with a new train station in Parkville.
Here is a map of private transport only mode share for journeys to the “Melbourne” SA2 (which represents the Melbourne CBD):
Private transport (only) mode shares were lower than 30% for most areas, as public and active transport options are generally cheaper and more convenient for travel to the CBD. However you can see corridors with higher private transport mode share, including Kew – Bulleen – Doncaster – Warrandyte, and Keilor East – Keilor – Greenvale (around Melbourne Airport). These corridors are more remote from heavy rail lines. Other patches of higher private mode share include Rowville – Lysterfield, Altona North, and Point Cook East (including Sanctuary Lakes).
A high private transport mode share does not necessary mean a flood of private vehicles are coming from these areas. Kinglake is the rich orange area in the north-east of the above map, and according the 2016 census, 57% of people commuted to the Melbourne CBD by private transport only. Except that 57% is actually just 23 out of just 40 people making that commute – which is pretty small number in whole scheme of things.
Which leads me to…
Journey volume and mode split maps
These maps show the volume (size of pie) and mode split for journeys from/to a selected SA2.
The following map shows the volume and mode split of journeys to the “Melbourne” SA2 in 2016:
As I discussed in a recent post, not many people actually commute from the outer suburbs to the central city. Indeed, only 767 people commuted from Rowville to the Melbourne CBD in 2016, which is less than one train full.
Unfortunately all the pie charts in the inner city tend to overlap, while the pie charts in the outer suburbs are tiny. Here’s a zoomed in map for the inner suburbs with a lot less overlap:
You can see large green wedges in the inner city, where walking or cycling to the CBD is practical. You can also see that almost everywhere the blue wedges (public transport) are much larger than the red (private transport).
What does stand out more in this map is Kew – where 716 people travelled to the Melbourne CBD by private transport (highest of any SA2) – with a relatively high 41% mode share for a location so close to the city, despite it being connected to the CBD by four frequent tram and bus lines. Kew is also a quite wealthy area, so perhaps parking costs do not trouble such commuters (maybe employers are paying?). Other home SA2s with high volumes and relatively high private mode shares are Essendon – Alberfeldie (521 journeys, 28% private mode share), Brighton (493, 33%), Keilor East (419, 41%), Toorak (404, 35%) and Balwyn North (396, 35%). Most of these are wealthy suburbs, with the notable exception of Keilor East, which does not have a nearby train station.
The home areas with significant numbers of Parkville commuters are in the inner northern suburbs, and active and public transport were the dominant mode share for these trips. While 92% of commuters from Burnside Heights to Parkville were by private transport, there were only 35 such trips. The overall private transport mode share for Parkville as a destination was 50%.
Here is the same type of map for Fishermans Bend (Port Melbourne Industrial), which is just south-west of the CBD:
Private transport dominates mode share, and you can see a slight bias towards the western suburbs. Which means a lot of cars driving over the Westgate Bridge.
Around 30,000 people travelled to work in Clayton in Melbourne’s south-east. Here’s a map showing the origins of those commutes:
Almost half of the workers who both live and work in Clayton walked or cycled (only) to work, of which I suspect many work at Monash University. The public transport mode shares are higher towards the north-west, particularly around the Dandenong train line that connects to Clayton. Very few people put themselves through the pain of commuting from Melbourne’s western and northern suburbs to Clayton.
Over 60,000 people commuted to Dandenong in 2016, which includes the large Dandenong South industrial area. Here are the volumes and mode splits for where they came from:
You can see a significant proportion of the workforce lived to the south-east, and much less to the north and west. You can also see private transport dominates travel from all directions (despite there being two train lines through the Dandenong activity centre, and a north-south SmartBus route through the industrial area).
Here‘s a look at people who commuted to work at Melbourne Airport:
You can see that airport workers predominantly came from the nearby suburbs, and the vast majority commuted by private transport. The most common home locations of airport workers include Sunbury South (543), Gladstone Park – Westmeadows (411), and Greenvale – Bulla (351 – note Greenvale has a much higher population than Bulla).
The largest public transport volume actually came from the CBD (48 out of 67 commuters, which is a 72% mode share), probably using staff discount tickets on SkyBus. The biggest trip growth 2011 to 2016 was from Craigieburn – Mickelham: 367 more trips of which 355 were by private transport only.
The data can also be filtered to only show a particular main mode. For example, here is a map of the origins for private transport trips to the Melbourne CBD (ie who drives to work in the CBD):
The most common sources of private transport trips to the CBD were generally very wealthy suburbs, where many people are probably untroubled by the cost of car parking (they can easily afford it, or someone else is paying). However bear in mind that not all SA2s have the same population so larger SA2s will be higher on the list (all other things being equal).
This data can also be viewed the other way around. Here are the volumes and mode splits of journeys from Point Cook South in 2016. The Melbourne CBD was the biggest destination (994 journeys) with 69% public transport mode share followed by Docklands (342 journeys) with 64% public transport mode share.
Here is yet another way to look at this data, which is particularly relevant for the central city…
Percentage of commuters who travel to selected workplace SA2s
Here is a map showing the proportion of commuters in each home SA2 who work in the Melbourne, Southbank or Docklands SA2s (the tool allows selection of up to three workplace SA2s):
There are some interesting patterns in this map. Generally the percentage of people commuting to central Melbourne declined with distance from the CBD. There are however some outlier SA2s that had relatively high percentages of people travelling to central Melbourne, despite being some distance from the city centre.
In fact, here is a chart showing distance from the CBD, and the percentage of commuters travelling to the central city:
Tableau has labelled some of the points, but not all (interact with the data in Tableau to explore more). The outliers above the curve are generally west or north of the city, with Point Cook South being the most significant outlier. Further from the city, the commuter towns of Macedon, Riddells Creek and Gisborne have unusually high percentage of commuters travelling to the central city for that distance from the city (made possible by upgraded V/Line train services). Many of the outliers below the curve are less wealthy areas, where people were less likely to work in the central city.
The previous map showed the proportion of all commuters that went to the central city. The tool can also filter that by mode. Here’s a map showing the percentage of public transport commuters who had a destination of Melbourne, Docklands or Southbank:
Typically around two-thirds of public transport journeys to work from most parts of Greater Melbourne are to Melbourne, Docklands, or Southbank SA2s. The lowest percentages were in the local jobs rich SA2s of Clayton (49%) and Dandenong (40%).
Adding Carlton and East Melbourne to the above three central city SA2s roughly takes the proportion up to around 70%. That’s a lot of public transport commutes to other destinations, but still a vast majority are focussed on the central city.
We can also look at this data from the origin end…
Where do people from a particular area commute to?
As an example, here is a map showing the percentage of commuters from Point Cook – South (a new and relatively wealthy area in Melbourne’s south-west) who worked in each work SA2 (destinations with less than 20 workers excluded):
You can see that 20% worked in the Melbourne CBD, followed by 7% in Docklands, and 6% in each of Point Cook North and Point Cook South (local). The largest nearby employment area is the industrial areas of Laverton, but this industrial area only attracted 4% of commuters from Point Cook South.
You can see that journeys to work are very scattered, with only 6% travelling to the Melbourne CBD.
(these maps can also be filtered by mode)
Another way to look at that data is a…
List of top commuter destinations
Here’s a chart showing the top work destinations from Rowville – Central in 2016, split by mode (this is a screenshot so the scroll bar doesn’t work):
You can see local trips are most numerous, and are dominated by private transport (although there were 48 active transport local trips). Dandenong was the second most common destination, with 97% private transport mode share, followed by Melbourne CBD with 40% private transport mode share (137 private transport journeys). The only other destination with high public transport mode share was Docklands at 59% (48 private transport journeys).
Changes between 2011 and 2016
We’ve so far looked at volumes and mode shares, but of course we can also look at the changes in volumes and mode share between 2011 and 2016.
There were around 15,000 more commutes to Dandenong in 2016 compared to 2011. Here are the changes in volumes by main mode for home SA2s with the largest total number of journeys:
You can see almost all of the new journeys to work were by private transport, no doubt putting a lot of pressure on the road network. A lot of the growth was from the suburbs to the east and south-east, none of which had a direct public transport connection to the Dandenong South industrial area at the time of the 2016 census. That’s now changed, with new bus route 890 linking the Cranbourne train line at Lynbrook with the Dandenong South industrial area (it operates every 40 minutes).
Note: a row with no figure or bar drawn (quite common in the Active only column) means that there were no such trips in either 2011 and/or 2016. Unfortunately the tool doesn’t show the change in volume in such circumstances (I’ll try to fix this in the future).
Brunswick is Parkville’s biggest source of workers, and there were many more such workers coming in by public and active transport, and a decline in workers who commuted by private transport. However there was an increase in private transport from places further out like Coburg and Pascoe Vale.
Of course you can do this the other way around too. Here‘s the new trips from Tarneit, a major growth area in Melbourne’s south-west where a train station opened in 2015:
Access to the Melbourne CBD by public transport improved significantly with the new train station, and 527 more people did that trip in 2016 compared to 2011. But the number of people who drove declined by only 35. The train line didn’t reduce the number of people driving out of Tarneit in total, but there probably would have been a lot more had it not opened. In the case of the Melbourne CBD, there were simply a lot more CBD workers living in Tarneit in 2016 (some CBD workers may have moved to Tarneit, and people otherwise in Tarneit were probably more likely to choose the CBD for work).
Here is a map of private transport mode shifts for journeys to the Melbourne CBD (were blue is mode shift to private transport and orange is mode shift away from private transport):
The biggest shifts away from private transport include Narre Warren North (-19%, but small volumes), Tarneit (-17%, with a train station opening in 2015), Wyndham Vale (-15%, also new train station), Don Vale – Park Orchards (-15%, with buses being primary mode for access to the CBD), Melton (-13%), and then -12% in Point Cook (new train station and bus upgrades in 2013), West Footscray – Tottenham, Sunbury (rail electrification 2012), South Morang (new train station), and Warrandyte – Wonga Park (SmartBus to city).
The biggest mode shifts to private transport were in low volume areas, including Monbulk – Silvan (+14%, which is an extra 5 trips), Keilor (+8%, 8 extra trips), Tullamarine (+8%, 16 extra trips), Lysterfield (+7%, 4 extra trips), Panton Hill – St Andrews (+7%, 4 extra trips) and more surprisingly Coburg North (+6%, up from 47 to 97 trips).
Again, you can see the problem with mode share and mode shift figures is that the volumes may be inconsequential. The map doesn’t show regions with less than 30 travellers, or less than 4 travellers by the selected mode. There was an overwhelming mode shift away from private transport for travel to the Melbourne CBD.
Here’s another view of the data: the change in the number of private transport trips to the Melbourne CBD, mapped:
That’s a peculiar mix of increases in decreases, but most of the volume changes are relatively small (note the scale).
The biggest increase was +142 trips from Truganina, a growth area with two nearby train stations built between 2011 and 2016. If that sounds alarming, it should be compared with an increase of 555 public transport trips from Truganina to the Melbourne CBD.
The larger declines were from suburbs like:
-85 from Doncaster East (bus upgrades),
-67 from Donvale – Park Orchards (bus upgrades),
-66 from Templestowe (also bus upgrades), and
-61 from Deer Park – Derrimut (also bus and train service upgrades).
Curiously, there was an increase of 71 private transport journeys to work entirely within the Melbourne CBD (to a new total of 236). Why anyone living and working in the CBD would go by private transport is almost beyond me – it’s very walkable and the trams are now free. Digging deeper…in 2016: 137 drove a car, 20 were a car passenger, 17 used motorbike/scooter, 13 a taxi, and 31 were “other” (okay, some of those 31 might have been skateboards or kick scooters, but we don’t know).
We can do the same by home location. Here are the net new trip destinations from Wyndham Vale in Melbourne’s outer south-west:
Wyndham Vale added more trips to the Melbourne CBD than trips to local workplaces.
Find your own stories
As mentioned, I’ve built interactive visualisations for all of this data, in Tableau Public, which you can use for free.
If you have a reasonably large screen, you might want to start with one of these four “dashboards” that show you volumes and mode shares, or volume changes and mode shifts. Choose a state, then an SA2, then you might need to zoom/pan the maps to show the areas of interest (unfortunately I can’t find a way to change the map zoom to be relevant to your selected SA2). The good thing about these dashboards is that you see mode shares and volumes on the same page.
Play around with the various filtering options to get different views of the data, including an option to turn on/off labels (which can overlap a lot when you zoom out), and change the colour scheme for mode share maps.
If you want more detail and/or have a smaller screen, then you might want to use one of the following links to a single map/chart:
Once you have the tool open in Tableau Public you can switch between the dashboards and worksheets with the tabs at the top (note: it will reset if you don’t use it for a while). You can mouse over the data to see more details (I’ve tried to list relevant data for each area), and often your filtering selections will apply to related tabs.
Finally remember to be careful in your analysis:
A large mode share or mode shift might not be for a significant volume.
A large change in volume might not be a significant mode shift.
Have fun!
[This post and the Tableau tool were updated 3 February 2018 with better label positions on maps. For larger SA2s, label positions better reflect the centre of residential or working population, as appropriate to the type of map. The Tableau tool should also be faster to load]
According to census data, private dwelling occupancy has been declining in most Australian cities (refer my earlier post on the topic). Could an increase in private dwellings dedicated to Airbnb rental – but vacant on census night (a Tuesday in winter) – explain much of this decline? Let’s look at the data.
Firstly here’s a reminder of private dwelling occupancy trends in Australia’s 16 largest cities.
Dwelling occupancy rates declined in all large cities (but rose in some smaller urban areas, particularly on Central (NSW), Sunshine, and Gold Coasts).
The ABS have advised me that their field officers would have no way of telling whether a dwelling is on Airbnb, and would therefore count them as private dwellings. So vacant Airbnb dwellings could account for unoccupied private dwellings.
How many of the additional unoccupied dwellings might be dedicated to Airbnb?
The fantastic site Inside Airbnb provides data scraped from the Airbnb website about listings in various cities. I’ve used available data extracted on 4 September 2016 for Melbourne and 4 December 2016 for Sydney (the closest data sets available to the August 2016 census). I’ve then filtered for entire home/apartment listings that had more than 90 days availability in the 12 months ahead and had been reviewed at least once in the last six months, to estimate the number of “active and dedicated” Airbnb dwellings. Definitely just an estimate.
For the area for which Melbourne Airbnb data is available (I’ve approximated Inside Airbnb’s unpublished boundary as SA3s with any listings in 2016) these Airbnb dwellings account for 0.19% of total private dwellings. For that same area, dwelling occupancy dropped 0.71% from 92.61% to 91.90% between 2011 and 2016.
According to a Melbourne University study using data from commercial Airbnb data site AIRDNA, around 62% of entire home/apartment Melbourne listings (that were not blocked out by owners) were unoccupied on Saturday 27 August 2016.
I’m guessing the Airbnb vacancy rate might have been higher on census night (a Tuesday). If say 70% of the Airbnb dwellings were empty on census night (just a guess), then they would account for 0.09% out of the 0.71% decrease in dwelling occupancy in Melbourne between 2011 and 2016, which is about 19%. Note: Airbnb barely existed in Melbourne in 2011 – there were only 161 Airbnb listings.
If somewhere between 60% to 80% of active/dedicated Airbnb properties were vacant, then they might explain between 16% and 21% the decline in dwelling occupancy in Melbourne.
For the equivalent area of Sydney, these Airbnb dwellings account for 0.22% of private dwellings, and there was a drop in private dwelling occupancy of 0.58% between 2011 and 2016. If somewhere between 60% to 80% of active/dedicated Airbnb properties were vacant, then they would explain between 23% and 30% of the decline in overall dwelling occupancy.
However I must stress these are rough estimates and might be over or under the actuals for several reasons:
It’s possible that some of these “entire home/apartment” listings are not counted by the ABS as dwellings (eg granny flats or segmented buildings that don’t have separate addresses) which would lead to over-estimates.
Some Airbnb listings that have less than 90 days availability in the 12 months ahead might just be very popular – leading to underestimates (my guess is that is unlikely).
The Sydney figure might be an overestimate because the Airbnb data was extracted three months after the census, and the total number of Airbnb listings almost doubled in 2016.
The actual Airbnb vacancy rate on census night might not have been in the 60-80% range.
I don’t know exactly where the city boundary was drawn for the Inside Airbnb data, but my approximation is more likely to be larger – which would lead to slight underestimates (probably very slight as the differences would be in peri-urban areas with few dwellings).
There may be other reasons – please comment.
That said, it looks like Airbnb might explain somewhere in the order of a fifth of the drop in private dwelling occupancy in Melbourne and Sydney between 2011 and 2016. Certainly not all of it, but probably not none of it either.
What proportion of dwellings are dedicated to Airbnb in different parts of Melbourne and Sydney?
Here’s a map of active/dedicated Airbnb dwellings (as per filter above) as a percentage of total dwellings in Melbourne at SA2 level:
It maxes out at 2.5% in the Melbourne CBD (that’s 1 in 40 dwellings), followed by Southbank and Fitzroy at around 1.9%. Mount Dandenong – Olinda is the orange patch to the east which measures 1.3%. View the data in Tableau.
As you would expect, Airbnb properties appear to be more prevalent around the inner city and tourist areas (eg St Kilda and the Dandenongs). These are also the areas with generally lower dwelling occupancy, and certainly some of the unoccupied dwellings in the census will be Airbnb dwellings.
Here is Sydney:
The highest rates are 2.6% around Bondi Beach, and 2.5% at Avalon – Palm Beach. Manly comes in at 1.5%, Surry Hills is 1.5%, Potts Point – Woolloomooloo is 1.4%, while the CBD area is 1.3%. Again, you can explore this Airbnb data in Tableau.
Could Airbnb properties explain the spatial differences in dwelling occupancy?
Here’s a plot of dwelling occupancy and Airbnb percentages for SA2s in Melbourne and Sydney.
I’ve done a linear regression on each city, and while the relationships are significant, they are not strong, and the correlation coefficients are -4.9 in Sydney and -1.5 in Melbourne. The signs are as expected (ie more Airbnb, lower occupancy), but the magnitudes are much higher than would be the case if Airbnb was the main explanation for lower dwelling occupancy (otherwise they would be around -1 or smaller). Which essentially means Airbnb presence is correlating with other drivers that would explain lower dwelling occupancy.
Indeed inner city and tourist areas had lower dwelling occupancy in both 2006 (when Airbnb didn’t exist) and 2011 (when Airbnb only had a tiny presence in Australia).
Therefore I think we can conclude Airbnb properties are more prevalent in areas where dwelling occupancy is lower for other reasons – one of which is likely to be popular places for visitors. Unoccupied Airbnb properties are almost certainly part of the pattern, but cannot explain the majority of the decrease in dwelling occupancy.
Can you do those Airbnb maps at higher resolution?
It’s getting a bit beyond the topic of transport, but yes I can go down to SA1 level. It’s not particularly important, but certainly interesting.
A disclaimer: Airbnb introduce randomised errors on property locations of up to 150 metres, so there will be some mis-attribution of properties to SA1s, but hopefully not too much. Also, I’m still only counting properties that match the above criteria.
Here’s inner Melbourne (note: different colour scale to last map):
Airbnb maxes out at 11% for three city blocks around Swanston Street and Collins Street, plus a large SA1 in East Melbourne that actually only contains a small residential area close to the CBD (including an apartment tower at 279 Wellington Parade). There’s also an SA1 in Southbank behind Crown Casino that is 10% Airbnb.
Curiously, there were only about 6 Airbnb listings in the New Quay apartments in Docklands that had 65-70% occupancy (refer earlier post), so Airbnb is definitely not to blame of the low occupancy of those towers.
Outside the central city, other hot spots are St Kilda around Acland Street (6%), just east of South Yarra Station (6%), and a patch of Olinda (5%). Explore in Tableau.
Here’s Sydney:
It tops out at 11% in the southern part of the CBD, with 10% in part of Pyrmont and 7% in pockets near Manly and Bondi Beach. Other hotspots include Coogee (6%) and Whale Beach further north (5%). Explore in Tableau.
Between 2011 and 2016, journey to work public transport mode shares went up significantly in Melbourne and Sydney but dropped significantly in Perth and Brisbane. Private transport mode shifts did the opposite. Can this be explained by the changing distribution of jobs within cities, or other factors such as changes in transport costs?
In a recent post focused on Brisbane I found that stronger growth in suburban jobs relative to central city jobs could explain around half of the city’s mode shift towards private transport, with other factors (mostly the changes in relative attractiveness of modes) explaining the rest.
So how is job distribution changing in other Australian cities? How much of the mode shifts can be attributed to changing job distribution and how much could be attributed to other factors like changes in transport costs, or increasing employment density?
(for details about how I define public, private and active transport, see the appendix in this post)
How is job distribution changing in Australian cities?
Here’s a view of the changing distribution of all jobs within each city by workplaces distance from the city centre.
(Unfortunately I only have 2006 data for Sydney and Melbourne)
The changes are relatively subtle, but if look at how the bands shift between years, you’ll see increasing centralisation in Sydney but a decentralisation in all other cities between 2011 and 2016.
The strongest decentralisation was in Brisbane and Perth, which also showed the biggest increases in private transport mode share.
However Melbourne saw both a slight decentralisation of jobs and a mode shift away from private transport between 2011 and 2016.
So we need to dig deeper to find out what’s going on here.
How does private mode share vary by distance from the city centre?
The following chart shows private transport mode shares by distance from the city centre for the last two or three censuses for each city. The darkest line for each city is for 2016, with lighter lines being previous years (I only have 2006 data for Melbourne and Sydney).
There’s a clear pattern in all cities that private mode shares are lower in areas closer to the city centre, with Sydney the lowest, followed by Melbourne, Brisbane, Perth, Adelaide, and Canberra (which is also the order of their population size).
Notably Sydney private mode share averaged lower than 90% out as far as 24km from the city centre, whereas Adelaide sees 90% mode shares as close as 2km from the city centre.
If you look carefully you can see that Brisbane increased private transport mode shares in the central city between 2011 and 2016, while private mode shares dropped or were stable in all other cities at most distances.
You can also see that the central city mode shifts away from private transport were largest in Melbourne, something I’ll come back to.
Here’s the same again but for public transport:
Sydney and Melbourne saw mode shifts to public transport at most distances from the city centre, unlike all other cities.
What mode shift can we attribute to changing job distributions?
A city’s mode share (measured by place of work) will be fundamentally impacted by two types of changes between censuses:
Changes in the volume of jobs in each SA2 – because different SA2s generally have different mode shares due to factors like proximity to the city centre and public transport access. If there is stronger jobs growth in areas that already had lower private mode shares, you would get a mode shift away from private transport, all other things being equal.
Changes in the mode share in each SA2 – because different modes became more or less attractive for commuters between census years. This might be due to changes in public transport service quality, transport infrastructure provision, and relative changes in the cost of public transport and private motoring and parking. It could also be influenced by broader demographic changes.
For each city I have calculated what the city-level private transport mode share would have been in 2016, had mode shares in each workplace SA2 remained exactly the same as 2011, but the job volumes in each SA2s had still changed. The city level mode shift due to SA2 volume changes is then the difference between this hypothetical 2016 mode share and the 2011 mode share. The remainder of the city-level mode shift between 2011 and 2016 results can then be attributed to mode shifts at the SA2 level.
Here’s a chart showing the mode shift impact of both volume changes at the SA2 level, and mode shifts at the SA2 level:
As we noted above, Sydney saw a slight trend to centralisation of jobs between 2011 and 2016, and it had the largest volume change attributed reduction in private mode share (-0.4%). However other factors were responsible for a further 2.5% of the mode shift away from private transport.
The story is similar in Melbourne but to a smaller magnitude in both aspects. Both of these cities also saw increasing inner city job density – which matters – and I’ll back come to that in a moment.
In Brisbane you can see that the total mode shift towards private transport was roughly equally attributable to SA2 volume changes and SA2 mode shifts (as I discussed in my earlier post).
Perth had an overall 1.3% mode shift to private transport, and the majority of this was due to significant jobs growth in the suburbs compared to the CBD (in fact, the SA2 with the largest jobs growth was Murdoch in the southern suburbs). But there were also other factors that led to a mode shift to private transport.
In Canberra – Queanbeyan, volume changes by themselves would have seen a mode shift to private transport, but other factors were larger and led to an overall mode shift away from private transport (although it is actually complicated because the 2011 census day was in a federal parliamentary sitting week, while 2016 was not).
Nothing much changed in Adelaide.
Next I’m going to explore what could be behind the mode shifts at SA2 level, in terms of job density and real transport costs.
Can increases in workplace density impact mode shares?
As discussed in my Brisbane analysis, if the relative attractiveness of modes hadn’t changed, you might still expect a mode shift to public transport in high density employment areas with increasing jobs numbers because you would expect the cost of parking provision to increase with increasing land use density (i.e. more competition for space).
Indeed, in Sydney and Melbourne a number of inner city SA2s became significantly more job dense between 2011 and 2016, and also saw mode shifts away from private transport:
A similar thing happened in Civic (the main centre of Canberra).
But Adelaide and Perth saw both declining job density and declining private transport mode share, which suggests something else is at play.
Job density didn’t really go down in Brisbane – see my Brisbane post for an explanation (basically, ABS redrew the SA2 boundary along the Brisbane River).
Could changes in the real cost of transport be causing mode shifts?
The following chart shows the real change in urban transport fares in Australian cities since 2000, as measured by the ABS as part of the Consumer Price Index series (which unfortunately includes public transport, taxis, and “ride share” but is for a representative sample of journeys so hopefully mostly dominated by public transport fares):
The lines are somewhat saw-toothed because public transport fares generally only rise once a year, and become better value in real terms over the course of the following 12 months.
Many cities have seen above-CPI public transport fare increases at various times, most notably Brisbane in 2010-2014. Melbourne has had above CPI fare increases, but also reduced zone 1+2 fares in 2015 which lead to a reduction on the ABS measure (the fare reduction only really applied to people travelling across zones 1 and 2 – which roughly summarised means travel between the outer and inner suburbs). Brisbane fares peaked in 2014, which was followed by a freeze and then a large reduction in 2017.
By contrast, here is the (negative) growth in the cost of “private motoring” (which includes vehicles, fuel and maintenance):
Private motoring costs have declined in real terms since 2000, although they increased a little during the second half of 2017.
The next chart shows the change in ratio between the two costs. Urban transport fares have become less competitive than private motoring over time in all cities:
But if we are looking at changes between census figures, we should probably also look at cost changes between the times of each census. Here’s how prices changed in real terms between the September quarters of 2011 and 2016 (which cover the August census dates):
The real cost of private motoring dropped in all cities, but so did the real “average” cost of urban transport fares in Sydney and Melbourne (the Melbourne drop being mostly around large fare reductions for travel across zones 1 and 2).
The biggest differences in cost changes were in Brisbane and Perth (around 18%), which I think will go a fair way to explaining why these cities had the biggest shifts to private transport attributable to SA2 mode shifts.
Brisbane saw a rapid increase in public transport fares between 2011 and 2014 which is likely to have changed many commuting habits, but those habits may or may not have changed back when fares were subsequently reduced (e.g. if someone bought a car due to fare increases, they may not have subsequently sold their car when fares reduced). Perth certainly had less mode shift at the SA2 level compared to Brisbane, which might support this hypothesis.
What about changes in car parking costs?
Unfortunately the ABS CPI’s private motoring cost index does not include car parking costs. But we do know about central city parking levies government charge in a bid to reduce road congestion.
Melbourne increased its central city parking levy from $930 to $1300 per space in 2014 (which has since risen to $1380 in 2017 with indexation), and created a new lower-price levy area in neighbouring areas in 2015. This was a significant change (in real terms) which is likely to have contributed to the larger mode shifts away from private transport in the central city area of Melbourne compared to other cities (particularly considering there were similar changes in average private motoring and urban transport fares in Melbourne between 2011 and 2016.
Central Sydney’s levy was $2390 in 2017, but has only risen with indexation since 2009 (when there was a significant jump from $950 to $2000 per space). Sydney also has a levy on some major employment centres other than the CBD (again, only indexation since 2009).
Perth has an annual licence fee per bay ranging from $1039 to $1169 per annum and I’m not aware of any price changes other than indexation.
I am not aware of any such fees or levies in Brisbane or Adelaide (although I note there was talk of introducing one in Adelaide).
Of course these will be only one influence. Parking prices will also be impacted by supply (influenced by competition for real estate, and planning rules) and demand (influenced by employment density) with the market ultimately determining prices. If anyone has found good time-series data on actual commuter parking prices I’d love to see it.
Did changes in population distribution impact mode shares?
While this post has been focused on changes by workplace location, it is possible to separate the overall mode shifts into the two components by home location. Here are the results:
In Sydney, Melbourne, and Canberra, stronger population growth in areas that already had low private mode shares in 2011 made a small contribution to overall mode shifts away from private transport. These cities have all seen densifying population in inner city areas better served by public transport.
The distribution of population growth in Perth and Brisbane had a small effect in the opposite direction.
And again, nothing much changed in Adelaide.
What about active transport?
Cycling-only mode share was pretty stable in most cities (except Canberra up 0.2%). Walking-only mode share declined in Sydney (-0.2%), Brisbane (-0.3%), Adelaide (-0.4%), Perth (-0.3%) but was steady in Melbourne and increased in Canberra (+0.2%). So Canberra has the biggest shift to active transport.
Can you summarise all that?
If your head is spinning with all that information, here’s a summary of what some of the major factors could be in each city between 2011 and 2016. I say “could be” because I’ve not looked at every possible factor influencing mode share:
Sydney: the 2.9% mode shift away from private transport was probably mostly to do with increasing job density in employment centres (more on that in my next post), but was also partly by a shift to more centralised jobs, and increasing population density in places well served by public transport.
Melbourne: The 1.8% mode shift away from private transport probably had a fair bit to do with increasing central city job density, the significant price increase and spatial expansion of the central city parking levy, a reduction in some public transport fares, and strong population growth in areas well served by public transport.
Brisbane: The 1.9% mode shift towards private transport appears roughly half about the decentralisation of jobs, and half the reduced attractiveness of public transport – particularly following significant fare rises between 2010 and 2014, and possibly/arguably declines in service quality.
Perth: The 1.2% mode shift towards private transport was probably mostly due to a decentralisation of jobs, and partly due to public transport becoming less cost competitive with private transport. Urban sprawl is probably also a factor.
Adelaide: The 0.2% mode shift to private transport is probably mostly due to public transport becoming less cost competitive with private transport. Changes in job and population distribution, and employment density do not appear to have had a significant impact.
Canberra: The 1.0% mode shift away from private transport was probably the result of competing forces of higher jobs growth in car-dominated workplace areas, increasing job density in dense employment centres, higher population growth in areas better served by public transport (and possibly cycling facilities), and also the fact census 2016 was not a parliamentary sitting week while 2011 was (so really, it’s hard to be too sure!).
You might want to add your own views about changes in the service quality of public transport and cycling infrastructure in each city. I also haven’t looked at the impact of major new public transport infrastructure and service initiatives (such as the opening of new train stations), which we know does impact mode shares at a local level (maybe that’s for a future post).
I hope you found this interesting. My next post will look at suburban employment centres, and their role in changing mode shares in cities.
Relatively dense suburban employment clusters can deliver more knowledge-based jobs closer to people living in the outer suburbs. Sydney has many such clusters, and Melbourne is now aiming to develop “National Employment and Innovation Clusters” as part of the city’s land use strategy, Plan Melbourne.
So what can we learn about existing employment clusters in Australian cities, particularly in regards to journeys to work? Can relatively dense suburban employment clusters contribute to more sustainable transport outcomes? Do such clusters have lower private transport mode shares than other parts of cities? How are mode shares changing for these clusters? How far do people travel to work in these clusters? Is there a relationship between job density, parking prices, and mode shares? How well served are these clusters by public transport? How do these clusters compare between cities?
This post investigates 46 existing clusters in Australia’s six largest cities. This is a longer post (there is a summary at the end), but I hope you find at least half as interesting as I do.
What’s a dense suburban employment cluster?
That’s always going to be an arbitrary matter. For my analysis, I’ve created clusters based on destination zones that had at least 40 employees per hectare in 2011 or 2016, were more than 4km from the city’s main CBD, and where collectively at least around 6,000 employees travelled on census day in 2016.
Unfortunately I can only work with the destination zone boundaries which may or may not tightly wrap around dense employment areas. Also, in order to ensure reasonable comparisons between census years, I’ve had to add in some otherwise non-qualifying zones to keep the footprints fairly similar. To mitigate potential issues with low density zones being included, I’ve used weighted employment density for each cluster in my analysis. But still, please don’t get too excited by differences in weighted job density as it’s far from a perfect representation of reality.
In particular, the following clusters include destination zones comprising both dense employment and non-employment land and so will potentially have understated weighted job density:
Nedlands
Fremantle
Bedford Park
Tooronga
Camberwell Junction
Hawthorn
Belconnen
Campbelltown
Hurstville
Kogarah
Randwick
North Ryde (quite significant – actual density is probably double)
Macquarie Park (a destination zone for the university includes large green areas)
Rhodes (significant residential area)
Parramatta (includes parkland)
Penrith (residential areas)
Bella Vista – Norwest – Castle Hill (includes a golf course)
I think my criteria is a fairly low threshold for suburban employment clusters, but raising the criteria too much would knock out a lot of clusters. I should note that some potential clusters might be excluded simply because they did not contain small destination zones concentrated on more dense areas.
Belmont in Perth was the lowest density cluster to qualify (weighted jobs density of 42 jobs / ha). Here’s what it looks like (in 3D Google Maps in 2018):
Chatswood in Sydney was the highest density cluster – with a weighted job density of 433 jobs / ha. Here’s what it looks like (in 3D Apple Maps in 2018):
Apologies if your favourite cluster didn’t make the criteria, or you don’t like my boundaries. You can look up the 2016 boundaries for each cluster here, or view them all through Google maps.
Where are these clusters?
On the following maps I’ve scaled the clusters by employment size and used pie charts to show the modal split for journeys to work in 2016. All pie charts are to the same scale across the maps (the size of the pie charts is proportional to the number of journeys to the cluster in 2016).
Note that North Sydney is excluded because it is within 4 km of the CBD.
All of Melbourne’s clusters are east of the CBD, with Clayton the largest. Places just missing out on the cluster criteria include parts of the Tullamarine industrial area (5271 jobs at 55 jobs/ha), Doncaster (around 5000 jobs at 40+ jobs/ha), Chadstone Shopping Centre (5375 jobs at 105 jobs/ha), and La Trobe (around 7700 jobs but low density – and even if there was a destination zone tightly surrounding the university campus I suspect it would still not qualify on density ground).
Only three suburban clusters qualified in Brisbane.
Note: the Nedlands and Murdoch clusters are essentially the hospital precincts only and do not include the adjacent university campuses.
Adelaide only has one suburban cluster that qualifies – Bedford Park – which includes the Flinders University campus and Flinders Medical Centre.
The Canberra clusters cover the three largest town centres, each containing at least one major federal government department head office.
What proportion of jobs are in these dense suburban employment clusters?
The following chart shows that Sydney and Canberra have been most successful at locating jobs in suburban employment clusters (well, clusters that meet my arbitrary criteria anyway!):
The proportion of jobs not in the inner 4km or a suburban employment cluster increased between 2011 and 2016 in all cities except Sydney (although the shift was very small in Melbourne).
Here’s a summary of private transport mode shares for the clusters, versus the inner city versus everywhere else:
Inner city mode shares vary considerably between cities, in order of population size. Total job cluster private mode shares are only 4-7% lower than elsewhere in most cities, except for Sydney where they are 17% lower.
Sydney’s clusters combined also have a significantly lower private mode share of 68% – compared to 84-89% in other cities.
How do the clusters compare?
Here is a chart showing their size, distance from CBD, and private transport mode share for journeys to work in 2016:
Next is a chart that looks at weighted job density, size, and private mode share for 2016. Note I’ve used a log scale on the X axis.
(Unfortunately the smaller Kogarah dot is entirely obscured by the larger Alexandria – Mascot dot – sorry that’s just how the data falls)
There is certainly a strong relationship between weighted job density and private mode shares (in fact this is the strongest of all relationships I’ve tested).
Sydney has many more clusters than the other cities (even Melbourne which has a similar population), it has much larger clusters, it has more dense clusters, and accounts for most of the clusters in the bottom-right of the chart.
And there’s just nothing like Parramatta in any other city. It’s large (~41,000 jobs in 2016), has relatively low private transport mode share (51%), is about 20 km from the Sydney CBD, and has a high jobs density.
Melbourne’s Clayton has about three-quarters the jobs of Parramatta, is around the same distance from its CBD, but is much less dense and has 90% private mode share for journeys to work.
Curiously Sydney’s Macquarie Park – which on my boundaries has about the same number of jobs as Parramatta – is closer to the Sydney CBD and has a much higher private transport mode share and a lower job density. However it’s rail service is relatively new, opening in 2009.
Perth’s Joondalup and Murdoch are relatively young transit oriented developments with relatively new train stations (opening 1992 and 2007 respectively), however they also have very high private transport mode shares, which I think highlights the challenge of creating suburban transit-adjacent employments clusters surrounded by low density suburbia.
Also, many of Sydney’s suburban clusters have a lower private mode share than that of the overall city (67.6%). That’s only true of Hawthorn and Camberwell Junction in Melbourne, Fremantle in Perth, and Woden and Belconnen in Canberra.
Some outliers to the top-right of the second chart include Heidelberg (in Melbourne), Liverpool (in Sydney), and Nedlands (in Perth). The Heidelberg and Nedlands clusters are relatively small and are dominated by hospitals, while 37% of jobs in Liverpool are in “health care and social assistance”. Hospitals employ many shift workers, who need to travel at times when public transport is less frequent or non-existent which probably explains their relatively high private transport mode shares. Heidelberg is located on a train line, and is also served by several relatively frequent bus routes, including one “SmartBus” route, but still has a very high private transport mode share of 85%.
Outliers to the bottom-left of the second chart include Randwick, Burwood, and Marrickville (all in Sydney). While these are less dense clusters, I suspect their relatively low private transport mode shares are because they are relatively inner city locations well served by public transport.
As an aside, if you were wondering about the relationship between job density and private mode shares for inner city areas, I think this chart is fairly convincing:
Of course this is not to say if you simply increase job density you’ll magically grow public transport patronage – there has to be capacity and service quality, and you probably won’t get the density increase without better public transport anyway.
How well connected are these job clusters to public transport?
Arguably the presence of rapid public transport is critical to enabling high public transport mode shares, as only rapid services can be time competitive with private transport. By “rapid” I consider services that are mostly separated from traffic, have long stop spacing, and therefore faster average speeds. For Australian cities this is mostly trains, but also some busways and light rail lines (but none of the clusters are served by what I would call “rapid” light rail). Of course there is a spectrum of speeds, including many partly separated tram and bus routes, and limited stops or express bus routes, but these often aren’t time competitive with private cars (they can however compete with parking costs).
I have classified each cluster by their access to rapid transit stations, with trains trumping busways (note Parramatta, Blacktown, Westmead, and Liverpool have both), and some clusters sub-classified as “edge” where only some edge areas of the cluster are within walking distance of a rapid transit station (although that’s not clear cut, eg Murdoch). Here are the public transport mode shares, split by whether journeys involved trains or not:
It’s probably of little surprise that all of the high public transport mode share centres are on train lines (except Randwick), and that most public transport journeys to these clusters involve trains. However the presence of a train station certainly does not guarantee higher public transport mode share.
Only four clusters have some degree of busway access (Chermside and Randwick are not actually on a busway but have a major line to them that uses a busway). Only Upper Mount Gravatt has a central busway stations, and it has the third highest non-train (read: bus) access share of 12%.
Randwick is an interesting exception – the University of New South Wales campus in this cluster is connected to Central (train) Station by high frequency express bus services which seem to win considerable mode share. A light rail connection is being constructed between Randwick and the Sydney CBD.
Non-rail (essentially bus) public transport mode shares are also relatively high in Bondi Junction (15%), Parramatta (11%), Belconnen (10%), Brookvale (10%), Woden (10%), Fremantle (9%), Macquarie Park (9%). These are all relatively strong bus nodes in their city’s networks.
Clayton and Nedlands are not on rapid transit lines, but both have high frequency bus services to nearby train stations which results in slightly higher train mode shares (4% and 5%). For Clayton, only the Monash University campus is connected by a high frequency express bus and it had a 17% public transport mode share, whereas the rest of the cluster had public transport mode shares varying between 3 and 7%.
The Bedford Park cluster is frustratingly just beyond reasonable walking distance of Tonsley Railway Station (12 minutes walk to the hospitals and almost half an hour’s walk to the university campus) – so only about 10 people got to work in the cluster by train in 2016. However that’s going to change with an extension of the train line to the Flinders Medical Centre.
The train-centred clusters with low public transport mode shares are mostly not in Sydney, and/or towards outer extremities of the train network (except Box Hill and Heidelberg in Melbourne). So what is it about Sydney’s trains that makes such a difference?
Sydney’s train network is distinctly different to all other Australian cities in that there are many more points where lines intersect (outside the central city), creating many “loops” on the network (for want of a better expression). In all other cities, lines only generally intersect in the central city and where radial lines split into branches, and cross city trips by public transport generally only possible by buses (in mixed traffic). In Sydney lines do branch out then but then often bend around to intersect other neighbouring lines. This provides significantly more connectivity between stations. For example, you can get to Parramatta from most lines directly or with a single transfer somewhere outside central Sydney. Indeed, Sydney is the only city with a regular non-radial train service (T5 Leppington – Richmond, although it only runs every half-hour).
I’ve roughly overlaid Sydney’s dense suburban job clusters (in red) on its rail network map, and then marked the train mode shares:
While some clusters can only be accessed by a radial train line (or are off-rail), many are at intersection points, and most can be accessed by multiple paths along the network. The 29%+ train mode shares for Chatswood, Parramatta, St Leonards, Burwood, and Rhodes might be partly explained by these being highly accessible on the train network.
Here are Melbourne’s dense suburban employment clusters and train mode shares overlaid on Victoria’s rail network map:
The clusters connected to more train lines (Hawthorn and Camberwell) have higher train mode shares, although they are also closer to the city.
The Spatial Network Analysis for Multimodal Urban Transport Systems (SNAMUTS) methodology (led by Professor Carey Curtis and Dr Jan Scheurer) uses graph-based analysis of public transport networks to develop several indicators of network performance. One indicator that measures network accessibility is closeness centrality, which looks and speed and frequency of services to connect to other nodes in the network (it actually uses inter-peak frequencies and speeds, but they probably correlate fairly well with services in peak periods). A lower score indicates better accessibility.
I’ve extracted the closeness centrality scores for public transport nodes in each employment clusters (from the nearest available data to 2016 at the time of writing, some as old as 2011 so not perfect) and compared this with private transport mode shares to these clusters:
Some clusters were not really centred on a public transport node in the SNAMUTS analysis (eg Osborne Park in Perth, Clayton in Melbourne) and hence are not included in this analysis. These clusters have very high private transport mode shares, and would likely be towards the top right of the chart.
There’s clearly a relationship between the closeness centrality and private mode shares, with low private more shares only occurring where there is high accessibility by public transport. But it’s not super-strong, so there are other factors at play.
Some of the outliers in the bottom right of the distribution include Upper Mount Gravatt (based on a large shopping centre but also on a busway), Murdoch (dominated by hospitals a moderate walk from the station), Nedlands (also dominated by hospitals), Chermside (a combination of hospital and large shopping centre, with the bus interchange remote from the hospital), and Bedford Park (where 63% of jobs are in health) . Again, the pattern of higher private transport mode shares to hospitals is evident.
So do you need strong public transport access to support higher job densities? Here’s the relationship between closeness centrality and weighted job density:
There are no clusters with poor public transport access and high job density, which is not surprising. But this does suggest it could be difficult to significantly increase job densities in clusters currently in the top left of this chart without significantly improving public transport access.
Interestingly, Box Hill in Melbourne does have a similar closeness centrality score to Parramatta and Chatswood in Sydney, suggesting it might be able to support significantly higher job density. However, it only has rapid (train) public transport from two directions. It might be more challenging to maintain bus and tram travel times from other directions if there is significant jobs growth.
Melbourne’s largest cluster – Clayton – is not on the chart because it is not centred on a public transport node. There is however a bus interchange on the southern edge of the cluster at Monash University, which has a relatively low closeness centrality score of 64. I suspect the main employment area would probably have a higher closeness centrality score if it were to be measured because it not connected to the train network by a high frequency express shuttle service and has fewer bus routes. That would place it in the top-left part of the above chart (2016 weighted job density being 63 jobs/ha).
Do higher density clusters have fewer car parks?
The higher density centres certainly tended to have lower private mode shares, but does that mean they don’t have much car parking?
Well I don’t know how many car parking spaces each centre had, but I do know how many people travelled to work by car only, and from that I can calculate a density of car-only journeys (and I’ve calculated a weighted average of the destination zones in each centre). That’s probably a reasonable proxy for car park density.
Here’s how it compares to jobs density (note: log scales on both axes):
There is a very strong correlation between the two – in general centres with higher job density also have higher car density. The strongest correlation I can find is for a quadratic curve that flattens out at higher job densities (as drawn, with R-squared = 0.77), which simply suggests you get lower private mode shares in higher density clusters (in general).
The clusters on the bottom side of the curve have lower car mode shares, and so have a lower car density. Many are inner city locations with better public transport access, but also many nearby residents.
Heidelberg (a hospital-based cluster in Melbourne), has the highest car density of all centres and a high job density, but isn’t a large centre.
Do walking mode shares increase when there are many nearby residents?
If there are many residents living within walking distance of a cluster, relative to the size of that cluster, then you might expect a higher walking mode share, as more employees of the cluster are likely to live nearby.
I’ve roughly summed the number of residents who travelled to work (anywhere) and lived within 1km of each cluster. I’ve then taken the ratio of those nearby working residents to the number of journeys into the cluster, and then compared that with walk-only mode shares for 2016:
Yes, there’s definitely a relationship (although not strong), and this may explain some of the outliers in the previous charts such as Randwick, Marrickville, St Leonards and Bondi Junction.
Is there a relationship between parking costs and mode shares?
It’s quite difficult to definitively answer this question because I don’t have parking prices for 2016, and many car commuters might not be paying retail prices (eg employer-provided free or subsidised parking).
I’ve done a quick survey using Parkopedia of parking prices for parking 8:30 am to 5:30 pm on Monday 2 July 2018, and picked the best price available in each cluster. Of course not everyone will be able park in the cheapest car park so it’s certainly not an ideal measure. An average price might be a slightly better measure but that would be some work to calculate.
But for what it worth, here is the relationship between July 2018 all day parking prices and 2016 private transport mode shares:
You might expect an inverse correlation between the two. Certainly clusters with very cheap or free parking had very high private transport mode shares, but other centres are scattered in the distribution.
Looking at outliers in the top right: I suspect Bedford Park (63% health workers), Heidelberg (hospital precinct), Tooronga (with one major employer being the Coles HQ), Chermside (including Prince Charles Hospital), and Rhodes will have significantly cheaper parking for employees (with visitors paying the prices listed on Parkopedia). Indeed, I could not find many parking prices listed for Rhodes, but there are clearly multi-storey parking garages near the office towers not on Parkopedia.
Looking at outliers in the bottom left: Relatively cheap $15 parking is available at multiple car parks in Bondi Junction. The $10 price in Chatswood was only available at one car park, with higher prices at others, so it is probably below the average price paid. Maybe traffic congestion is enough of a disincentive to drive to work in these centres?
For interest, here’s the relationship between weighted car density and parking prices:
The relationship is again not very strong – I suspect other factors are at play such as unlisted employer provided car parking, as discussed above.
So does job growth in suburban employment clusters lead to lower overall private transport mode shares?
Here is a chart showing the effective private mode share of net new trips in each job cluster, plus the inner 4 km of each city:
(Fremantle, Dandenong, Burwood, and Woden had a net decline in jobs between 2011 and 2016 and so have been excluded from this chart)
The chart shows that although many suburban jobs clusters had a low private mode share of net new trips, it was always higher than for the inner 4 km of that city.
Here’s a summary of net new trips for each city:
So every new 100 jobs in suburban employment clusters did generate many more private transport trips than new jobs in the inner city, particularly for Sydney (45 : 10), Melbourne (68 : 13), and Canberra (84: 18). But then new jobs in suburban employment clusters had significantly lower private transport mode shares than new jobs elsewhere in each city.
So arguably if you wanted to minimise new private transport journeys to work, you’d aim for a significant portion of your employment growth in the central city, and most of the rest in employment clusters (ideally clusters that have excellent access by rapid public transport). Of course you would also want to ensure your central city and employment clusters were accessible by high quality / rapid public transport links (not to forget active transport links for shorter distance commutes).
One argument for growing jobs in suburban employment clusters is that new public transport trips to suburban employment clusters will often be on less congested sections of the public transport network – particularly on train networks (some would even involve contra-peak travel relative to central city). On the other hand, new jobs in the central city have much higher public transport mode shares, but relatively expensive capacity upgrades may be required to facilitate the growth.
New active transport trips to the central city and employment clusters probably requires the least in terms of new infrastructure, and there are probably very few congested commuter cycleways in Australian cities at present.
Another argument for suburban employment clusters is to bring jobs closer to people living in the outer suburbs.
Are new private transport trips to suburban employment clusters much shorter than new private transport trips to the central city, and therefore perhaps not as bad from a congestion / emissions point of view?
Certainly many of these clusters will have congested roads in peak periods, but the distance question is worth investigating.
So how far do people travel to work in different employment clusters?
The 2016 census journey to work data now includes on-road commuting distances (thanks ABS!).
Of course for any jobs cluster there will be a range of people making shorter and longer distance trips and it is difficult to summarise the distribution in one statistic. Averages are not great because they are skewed by a small number of very long distance commutes. For the want of something better, I’ve calculated medians, and here are calculations for Sydney job clusters:
(I’ve added a “Sydney” jobs cluster which is the “Sydney – Haymarket – The Rocks” SA2 that covers the CBD area).
There’s a lot going on in this data:
Median distances for private transport commutes to most employment clusters are longer than to the CBD (particularly the big clusters of Macquarie Park and Parramatta).
The clusters of Brookvale, Bondi Junction, and Randwick near the east coast have lower medians for motorised modes, probably reflecting smaller catchments. Randwick and Brookvale also do not have rail access, which might explain their low median public transport commute distances.
Public transport median commute distances were longer in the rail-based near-CBD clusters of Bondi Junction, Alexandria – Mascot, and St Leonards, but also in some further out rail-based clusters, including Parramatta, Westmead and Penrith.
Penrith – the cluster furthest from the Sydney CBD – curiously had the longer public transport median commute distance, which probably reflects good access from longer distance rail services (but public transport mode share was only 14%).
Active transport medians vary considerably, and this might be impacted by the mix of shorter walking and longer cycling trips. For example, North Ryde saw more cycling than walking trips, but also had only 1% active transport mode share.
Here’s the same for Melbourne (with a cluster created for the CBD):
Clayton, Dandenong, and Melbourne CBD median commute distances were very similar, whereas median commutes to other clusters were mostly shorter.
Here are results for clusters in the smaller cities:
In Perth, Joondalup had shorter median commuter distances, while Osborne Park and Murdoch (both near rapid train lines) had the longest median public transport journey distances (but not very high public transport mode shares: 7% and 15% respectively). Half of the suburban clusters had a longer median private transport distance than the CBD, and half were shorter.
In Brisbane, median private commute distances were shorter in Chermside, but similar to the city centre for other clusters.
Coming back to our question, only some suburban employment clusters have shorter median private transport commute distances. I expect the slightly shorter distances for those clusters would not cancel out the much higher private transport mode shares, and therefore new suburban cluster jobs would be generating more vehicle kms than new central city jobs.
But perhaps what matters more is the distance travelled by new commuters. New trips from the growing urban fringe to a CBD would be very long in all cities. While ABS haven’t provided detailed journey distance data for 2011, some imperfect analysis of 2011 and 2016 straight line commuter distances between SA2s (sorry not good enough to present in detail) suggests average commuter distances are increasing by 1-2 kms across Sydney and 2-3 kms across Melbourne, and these increases are fairly consistent across the city (including the central city). This may reflect urban sprawl (stronger in Melbourne than Sydney), with new residents on the urban fringe a long way from most jobs.
So did private transport mode shares reduce in suburban employment clusters?
Yes, they did reduce in most clusters, but some saw an increase of up to 2%.
The cluster with the biggest shift away from private transport was Rhodes in Sydney (relatively small and only moderately dense), followed by Perth’s fastest growing hospital cluster of Murdoch.
But perhaps more relevant is how fast each cluster is growing and the mode share of new jobs:
If you want to reduce private transport travel growth, then you don’t want to see many clusters in the top right of this chart (growing fast with high dependency on private transport). Those centres could be experiencing increasing traffic congestion, and may start to hit growth limits unless they get significantly improved public transport access.
Of the cluster in the top-right:
Bella Vista – Norwest – Castle Hill will soon have a rapid rail service with Sydney Metro.
Murdoch’s high private transport mode share might reflect the fairly long walking distance between the station and hospitals (up to 10 minutes through open space with no tree canopy), but also hospital shift workers who may find private transport more convenient.
Clayton might reflect most jobs being remote from the train line (although it is served by three SmartBus routes that have high frequency and some on-road priority). Note: my Monash cluster unfortunately does not include the Monash Medical Centre that is closer to Clayton Station and very job dense. The hospital precinct had its own destination zone in 2016 with 88% private transport mode share, but was washed out in a larger destination zone in 2011 which made it difficult to include in the cluster (for the record, that 2011 destination zone also had an 88% private transport mode share).
Joondalup is a large but not particularly dense employment area, and I suspect many jobs are remote from the train/bus interchange, and some local bus frequencies are low.
Can you predict mode shares with a mathematical model?
I have put the data used above into a regression model trying to explain private transport mode shares in the clusters. I found that only weighted job density, walking catchment size, and distance from CBD were significant variables, but this might be for want of a better measure of the quality of public transport accessibility (SNAMUTS Closeness Centrality scores are not available for many centres).
I also tested the percentage of jobs in health care and social assistance (looking for a hospital effect), the surrounding population up to 10km (nearby population density), median travel distances, and the size of clusters, but these did not show up as significant predictors.
Can you summarise all that?
Compared to other cities, Sydney has many more clusters and they are larger, more dense, and generally have much lower private transport mode shares.
With the exception of Canberra, less than half of all jobs in each city were in either the inner city area or a dense suburban jobs cluster. In Perth it was as low as 32%, while Sydney was 45%, and Canberra 54%.
Higher density clusters correlate with lower private transport mode shares.
Only higher density clusters centred on train stations with strong connections to the broader train network achieve relatively high public transport mode shares of journeys to work.
High quality bus services can boost mode shares in clusters, but the highest bus-only mode share was 15% (in 2016).
High-frequency express shuttle bus services can boost public transport mode shares in off-rail clusters.
Walk-only mode shares for journeys to work are generally very low (typically 2-5%) but generally higher in clusters where there are many nearby residents.
Private transport mode shares are generally 90%+ in clusters with free parking.
I suspect there is a relationship between parking prices and private mode share, but it’s hard to get complete data to prove this. Subsidised employer provided parking probably leads to higher private transport mode shares, and may be common at hospitals. However unexpectedly cheap parking in Bondi Junction and Chatswood needs to be explained (perhaps an oversupply, or just horrible traffic congestion?).
There is some evidence to suggest hospitals are prone to having higher private transport mode shares, possibly due to significant numbers of shift workers who need to commute at times when public transport service levels are lower.
Private transport shares in suburban clusters are much higher than central cities, but lower than elsewhere in cities. The private transport mode share of net new jobs in clusters is much higher than for central city areas, but generally lower than elsewhere in cities.
High density clusters still have large amounts of car parking.
Median commuter distances to suburban employment clusters are sometimes longer and sometimes shorter than median commuter distances to each cities CBD.
The clusters of Joondalup, Clayton, Murdoch, and Bella Vista – Norwest – Castle Hill have grown significantly in size with very high private transport mode shares. These centres might be experiencing increased traffic congestion, and their growth might be limited without significant improvements in public transport access.
What could this mean for Melbourne’s “National Employment and Innovation Clusters”?
One motivation for this research was getting insights into the future of Melbourne’s National Employment and Innovation Clusters (NEICs). What follows is intended to be observations about the research, rather than commentary about the whether any plans should be changed, or certain projects should or should not be built.
Firstly, the “emerging” NEICs of Sunshine and Werribee didn’t meet my (arguably) low criteria for dense employment clusters in 2016 (too small). The same is true for the Dandenong South portion of the “Dandenong” cluster (not dense enough).
Parkville and Fishermans Bend would have qualified had I not excluded areas within 4km of the CBD.
Significant sections of the Parkville, Fishermans Bend, Dandenong, Clayton, and La Trobe NEICs are currently beyond walking distance of Melbourne’s rapid transit network. Of these currently off-rail clusters:
Clayton: New light and heavy rail links are proposed. The Monash University campus has had paid parking for some time, but there appears to be free parking for employees in the surrounding industrial areas to the north and east. It will be interesting to see if/when paid parking becomes a reality in the industrial area (commuter densities ranged from 48 to 74 jobs/ha in 2016, not dissimilar to Fishermans Bend). The Monash Medical Centre area is relatively close to Clayton train station, has very high commuter density (329 per hectare in 2016 before a new children’s hospital opened in 2017) and had 88% private transport mode share in 2016. No doubt car parking will be an ongoing challenge/issue for this precinct.
La Trobe: No rapid transit links are currently proposed to the area around the university, which had an 83% private transport mode share in 2016. There is a currently a frequent express shuttle bus from Reservoir station to the university campus, and a high frequency tram route touches the western edge of the campus.
Dandenong South: The area is dominated by industrial rather than office facilities, and the job density ranges from 7 to 33 commuters per hectare, which is relatively low compared to the clusters in my study. There are no commercial car parks listed on Parkopedia so I assume pretty much all employees currently get free parking. No rapid transit stations are proposed for the area. The area is served by a few bus routes, including one high frequency SmartBus route, but 98% of new jobs between 2011 and 2016 were accounted for by private transport trips. This suggests it is difficult even for high-frequency (but non-rapid) public transport to complete with free parking in such areas.
Another potential challenge is connectivity to Melbourne’s broader train network. Parkville (and Fishermans Bend should Melbourne Metro 2 be built) will be well connected to the broader network by the nature of their central location. The area around Sunshine station has excellent rail access from four directions (with a fifth proposed with Melbourne Airport Rail). Dandenong, La Trobe and Werribee are on or near 1 or 2 radial train lines.
You can read more about Melbourne’s employment clusters in this paper by Prof John Stanley, Dr Peter Brain, and Jane Cunningham, which suggests there would be productivity gains from improved public transport access to such clusters.
Private and public transport journey to work mode shares vary considerably both between Australian cities and within them. Are these differences related to factors such as population density, motor vehicle ownership, employment density, proximity to train stations, proximity to busway stations, jobs within walking distance of homes, and distance from the city centre?
This posts sheds some light on those relationships for Australia’s six largest cities. I’m afraid it isn’t a short post (so get comfortable) but it’s fairly comprehensive (over 30 charts).
I should stress up front that a strong relationship between a certain factor and high or low mode shares does not imply causation. There are complex relationships between many of these factors, for example motor vehicle ownership rates are generally lower in areas of higher residential density (which I will also explore), and more factors beyond what I will explore here.
If you are interested in seeing spatial mode share patterns, see previous posts for Melbourne, Brisbane, and Sydney. You might also be interested in my analysis explaining the mode shifts between 2011 and 2016.
Population density
Higher population densities are commonly associated with higher public transport use. This stands to reason, as high density areas have more potential users per unit of area, but also higher density is likely to mean high land prices, which in turn increases the cost of residential parking. But higher public transport mode share can only happen if government’s invest in higher service levels, and this isn’t guaranteed to happen (although it often does, through pressures of overcrowding).
My preferred measure is population weighted density, which is the weighted average density of land parcels in a city, weighted by their population (this gets around problems of including sparsely populated urban land). I’ve measured it at census district (CD) geography for 2006 and Statistical Area Level 1 (SA1) geography for 2011 and 2016, using 2011 Significant Urban Area boundaries to define cities. The 2006 density figures are not perfectly comparable with 2011 and 2016 because CDs are slightly larger than SA1s, so the density values will be calculated as slightly smaller.
Here is the relationships at city level (the thin end of each worm is 2006 and the thick end 2016, with 2011 in the middle):
The relationship is very strong for Melbourne and Sydney over time. Between 2011 and 2016, Perth and Brisbane saw increased population density but reduced public transport mode share (mostly because of changes in the distribution of jobs between the centre and the suburbs).
Brisbane was a bit of an outlier in 2006 and 2011 with high public transport mode share relative to its lower population density.
Canberra is also perhaps a bit of an outlier, with much lower public transport mode share compared to similarly low density cities. This might be explained by the smaller total population, lower jobs density, and lack of rapid public transport services segregated from traffic.
But Canberra does have higher active transport mode share, so it’s worth doing the same analysis with private transport mode shares:
Brisbane was still an outlier in the relationship in 2006 and 2011, but Canberra is more in line with other data points.
Another interesting note is that Canberra went from being the least dense city in 2006 to the third most dense in 2016.
Drilling down to SA2 geography (SA2s are roughly the size of a suburb), here’s a chart showing all SA2s in all cities across the three census years (filtered for CDs and SA1s with at least 5 persons per hectare). I’ve animated it to highlight one city at a time so you can compare the cities, and I’ve used a log scale on the X-axis to spread out the data points (only the Sydney and Melbourne CBDs go off the chart to the right).
(if these animated GIF charts are not clear on your screen, you can click to enlarge the image, then use “back” to come back to this page).
You can see a fairly strong relationship, although it is very much a “cloud” rather than a tight relationship – there are other factors at play.
What I find interesting is that Sydney has had a lot of SA2s with population weighted densities around 50-100 but private mode shares over 55% (toward the upper-right part of the cloud of data points) – which are rare in all other cities. That’s a lot of traffic generation density, which cannot be great for road congestion. In a future post I might focus in on the outlier SA2s that are in the top right of these charts (can public transport do better in those places?).
In case you are wondering about the Brisbane SA2 with low density and low private transport mode share (middle left of chart) it is the Redland Islands where car-carrying ferries are essential to get off an island, and are counted as public transport in my methodology. The Canberra outlier in the bottom left is Acton (which is dominated by the Australian National University).
Employment density
I’ve calculated a weighted job density in the same way I’ve calculated population weighted density, but using Destination Zones (which can actually be quite large so it certainly isn’t perfect). Weighted job density is a weighted average of job densities of all destination zones, weighted by the number of jobs in each zone. In a sense it is the density at which the average person works
(technical notes: I’ve actually only counted jobs as people who travelled on census day and reported their mode(s) of travel. Unfortunately I only have 2006 data for Sydney and Melbourne)
This chart suggests a very strong relationship at the city level, with all cities either moving up and left (Adelaide, Perth and Brisbane) or down and right (Sydney, Melbourne, Canberra).
So is the relationship as strong when you break it down to the Destination Zone level? The next chart shows jobs density and private mode share for all destination zones for 2016. Note that there is a log scale on the x-axis, and Adelaide dots are drawn on top of other cities in the top left which explains why that dense cloud of dots appears mostly green.
There’s clearly a strong relationship, although again the data points form a large cloud rather than tightly bunch around a line, so other factors will be at play.
It’s also interesting to see that the blue Sydney dots are generally lower than other cities at all job densities. That is, Sydney generally has lower private transport mode shares than other cities, regardless of employment density.
Which leads us to the next view: the private transport mode shares for jobs in different density ranges in each city for 2011 and 2016.
(click to enlarge if the chart appears blurry)
You can see a fairly consistent relationship between weighted job density and mode shares across all cities in both 2011 and 2016.
At almost all job density ranges, Sydney had the lowest average private transport mode share, while Adelaide and Perth were generally the highest (data points are not shown when there are fewer than 5 destination zones at a density range for a city). This shows that something other than jobs density is impacting private transport mode shares in Sydney. Is it walking catchment, public transport quality & quantity, or something else?
For more on the relationship between job density and mode share, see this previous post.
Proximity to public transport
Trains generally provide the fastest and most punctual public transport services (being largely separated from road traffic and having longer stop spacing), and are the most common form of rapid transit in Australian cities. So you would expect higher public transport mode shares around train stations.
Here is a chart showing average journey to work public transport mode shares by home distance from train stations. It’s animated over the three census years, with a longer pause on 2016.
Technical note: A limitation here is that I’ve measured all census years against train stations that were operational in 2016 – so the 2006 and 2011 mode shares will be under-stated for the operational stations of those years. For example, in Melbourne the following stations opened between 2011 and 2016: Williams Landing, South Morang, Lynbrook, and Cardinia Road.
You can see that public transport shares went up between 2006 and 2011 in most cities at all distances from train stations. In both Perth and Brisbane there were new train lines opened between 2006 and 2011, which will explain some of that growth.
But if you watch carefully you will see public transport mode shares near train stations fell in both Brisbane and Perth between 2011 and 2016. That is, there was a mode shift away from public transport, even for people living close to train stations. As discussed previously, this is most likely related to there being only small jobs growth in the CBDs of those cities between 2011 and 2016, compared to suburban locations.
You can also see that public transport mode shares aren’t that much higher for areas near train stations in Adelaide (I’ll come back to that).
We can do the same for train mode shares (any journey involving train):
Again, Sydney’s train stations seem to have the biggest pulling power, while Adelaide’s have the least.
Busways are the other major form of rapid transit in Australian cities, with major lines in Brisbane, Sydney and Adelaide. Here is a chart of public transport mode share by distance from busway stations, excluding areas also within 1.5 km of a train station:
Note for Adelaide this data only considers suburban stations on the O-bahn, and not bus stops in the CBD. For Sydney all “T-Way” station are included, plus the four busway stations on the M2 motorway for which buses run into the CBD (but not the relatively short busway along Anzac Parade in Moore Park). Sydney’s north west T-Ways opened in 2007
Proximity to a busway station appears to influence public transport mode share strongly in Brisbane and Adelaide, where busways are mostly located in the inner and middle suburbs and cater for trips to the CBD. Sydney’s busway stations are in the “outer” western suburbs, feeding Blacktown, Parramatta, but also relatively long distance services to the Sydney CBD via the M2.
Curiously, public transport mode shares were higher in places between 3 and 5 km from busway stations in Sydney, compared to immediately adjacent areas. I’m not sure that I can explain that easily, but it suggests equally attractive public transport options exist away from busway and train stations.
The station proximity influence appears to extend around 1 km, which possibly reflects the fact that few busway stations have park and ride facilities, and are therefore more dependent on walking as an access mode (although cycling may be another station access mode).
Over time Sydney public transport mode share lifted at all distances from busway stations, while in Brisbane it rose in 2011 and then fell again in 2016, in line with other city mode shares.
So are busway stations similar to train stations in their impact on public transport mode share? To answer this I’ve segmented cities into areas near train stations, near busway stations, near both, and near neither. I’ve used 1.5 km as a proximity threshold that might represent an extended walking catchment.
In Sydney, train stations appear to have a much stronger influence on public transport mode shares than busway stations, but the opposite is true in Brisbane and Adelaide. This possibly reflects the much higher service frequencies on Adelaide and Brisbane busways compared to their trains, and the fact Sydney’s busway stations are so far from the CBD (and thus have fewer workers travelling to the CBD where public transport dominates mode share).
Also of note in this chart is that for areas more than 1.5 km from a train or busway station, Sydney had a much higher public transport mode share compared to the other cities. These areas will be served mostly by on-road buses, but also some ferries and one light rail line. Adelaide has the least difference between mode share for areas near and not-near train or busway stations.
We can do the a similar analysis for workplaces:
The most curious pattern here is Adelaide – where public transport mode share was highest for jobs between 1.5-2.5 kms from train stations. This distance band is dominated by the centre of the Adelaide CBD (the station being on the edge, arguably a “corner”), for which bus was the dominant public transport access mode. Also, there was no destination zone small enough near Adelaide central train station to register as 0 – 0.5 km away, and only one that is 0.5 – 1 km away (I use distances between station data points and destination zone centroids). So the results might look slightly different if smaller destination zones were drawn in the Adelaide CBD.
In all other cities there was a very strong relationship between train station proximity and public transport mode share, as you would expect. And Sydney again stands out with high public transport mode shares for workplaces more distant from train stations.
If you are wondering, the bump in Sydney at 2.5 to 3 km includes the Kensington / Randwick area which has high employment density and a strong bus connection to the central city (partly assisted by the Anzac Parade busway). And the relatively high figure for Melbourne at 1 – 1.5 km includes parts of Docklands, Parkville, Southbank, and St Kilda Road, which all have high tram service levels.
Unfortunately destination zones around busway stations are generally too large to provide meaningful insights so I’m not presenting such data.
Motor vehicle ownership
It will come as little surprise that there is a relationship between household motor vehicle ownership and journey to work mode shares.
Here’s a summary chart for each city for the 2006, 2011 and 2016 censuses:
There appears to be a fairly strong relationship between the two factors at city level.
Sydney and Melbourne have seen the largest mode shift away from private transport, but only Melbourne has also seen declining motor vehicle ownership rates.
Canberra saw only weak growth in motor vehicle ownership between 2011 and 2016, and at the same time there was a shift away from private transport (and a large increase in population weighted density).
Perth and Brisbane saw increasing private transport mode share and increasing motor vehicle ownership between 2011 and 2016.
Here’s a more detailed look at the relationship over time for Melbourne at SA2 geography:
The outliers on the upper left are generally less-wealthy middle-outer suburban areas (lower motor vehicle ownership but high private mode share), while the outliers to the lower-right are wealthy inner suburbs where people can afford to own plenty of motor vehicles, but they didn’t use them all to get to work.
In the bottom left of the chart are inner city SA2s with declining private mode share and declining motor vehicle ownership. For motor vehicle ownership rates around 70-80 (motor vehicles per persons aged 18-84), there are many SA2s with private mode shares that declined 2006 to 2016, but not significantly lowering motor vehicle ownership rates. That suggests that just because people own many motor vehicles, they don’t necessarily use them to drive them to work.
Here is the same data for Sydney:
There are many SA2s with motor vehicle ownership rates around 50 to 70 where the private mode shares are dropping faster than motor vehicle ownership. But there are also many areas with high private mode shares and increasing rates of motor vehicle ownership.
How do the other cities compare? Here are all the SA2s for all cities on the same chart, with alternating highlighted cities:
You can see big differences between the cities, but also that Brisbane and Perth have many SA2s with very high private mode share and rapidly increasing motor vehicle ownership (ie moving up and right, although it’s a little difficult to see with so many lines overlapping). Melbourne and Sydney have plenty of SA2s moving down and left – reducing motor vehicle ownership and declining private transport mode share (which may make some planners proud).
Of course there will be a relationship between motor vehicle ownership and where people choose to live and work. People working in the central city may prefer to live near train stations so they can avoid driving in congested traffic to expensive car parks. People who prefer not to drive might choose to live close to work and/or a frequent public transport line. People who are happy to drive to work in the suburbs might avoid higher priced real estate near train stations or the inner city.
As an aside, we can compare total household motor vehicles to the number of people driving to work, to estimate the proportion of household motor vehicles actually used in the journey to work. Here is Melbourne:
SA2s with a lower estimate are generally nearer the CBD, are wealthier areas, have reasonable public transport accessibility, and/or might be areas with a higher proportion of people not in the workforce (for whatever reason). The areas where the highest proportion of motor vehicles are required for the journey to work are relatively new outer suburbs on the fringe (perhaps suggesting forced car ownership), where adult workforce participation is probably high and public transport accessibility is lower.
The proportion of cars used in the journey to work declined on average in many parts of Melbourne. Given that motor vehicle ownership rates in Melbourne barely changed between 2011 and 2016, this probably represents people mode shifting, rather than people acquiring more motor vehicles even though they don’t need them to drive to work.
Jobs within walking distance of home
It stands to reason that people would be more likely to walk to work if there were more work opportunities within walking distance of their home.
For every SA1 I’ve measured how many jobs are approximately within 1 km as a notional walking catchment (measured as the sum of jobs in destination zones whose centroid are within 1 km of the centroid of each home SA1, so it is not perfect). Here’s the relationship with walking mode share:
(there are a lot of dots overlapping in the bottom left-corner and Adelaide dots have been drawn on top so try not to get thrown by that).
You don’t have to have a lot of nearby jobs to get a higher walking mode share, but if you do, you are very likely to get a high walking more share. The exceptions (many jobs, but low walking share) include many parts of Parramatta (Sydney), and areas separated from nearby jobs by water bodies or other topographical barriers (eg Kangaroo Point in Brisbane).
Workplace distance from the city centre
As was seen in a previous post, workplaces closer to city centres had much lower private transport mode shares, which is unsurprising as these are locations with generally the best public transport accessibility, high land values that can lead to higher car parking prices (which impact commuters who pay them), and often higher traffic congestion.
Here is a chart showing private transport mode share by workplace distance from the city centre. I’ve used faded lines to show 2011 and 2006 results (2006 only available for Sydney and Melbourne).
Here’s a chart that shows the mode shifts between 2011 and 2016:
Inner Melbourne had the biggest mode shifts away from private transport (particularly in Docklands that falls into the 1-2 km range, which saw significant employment and tram service growth), but Sydney had more consistent mode shifts across most distances from the city centre. Adelaide and Canberra saw mode shifts away from private transport in the inner city but towards private transport further out.
Brisbane and Perth saw – on average – a mode shift to private transport across almost all distances from the city centre, with the highest mode shift to private transport in Brisbane actually for the CBD itself(!).
Home distance from the city centre
There’s unquestionably a relationship here too, and it’s probably mostly driven by public transport service levels being roughly proportional to distance from the CBD, but also the proportion of the population who work in the CBD being much higher for homes nearer the CBD.
Sydney had the lowest average private transport mode share at all distances up to 20 km from the CBD, followed by Melbourne and Brisbane, in line with overall mode shares.
The trends over time are also interesting. Brisbane saw mode shifts towards private transport at all distances more than 2 km from the city centre between 2011 and 2016. However there were not significant shifts for Perth outside the city centre – that is: modes shares by geography didn’t change very much. The mode shift away from public transport in Perth is best explained by the shift in jobs balance away from the city centre.
Here are public transport mode shares by home distance from city centres:
In most cities, public transport mode share peaked at a few kilometres from the city (as active transport has a higher mode in the central city).
Here are public transport mode shifts by distance from the city centre between 2011 and 2016:
The significant shift in central Melbourne is likely to be largely explained by the Free Tram Zone introduced in 2015. Outside of the city centre the mode shifts are surprisingly uniform across each city.
Here’s the same chart for 2006-2011, and you can clearly see the impact of the opening of the Mandurah railway line in Perth with significant mode shift beyond 30 km:
Curiously there was a massive shift to public transport for CBD residents in Melbourne (and this is before the free tram zone was introduced).
So which factors best explain the patterns in mode shares across cities?
What we’ve clearly seen is that higher public transport mode shares are seen for journeys to work…
to higher density workplaces
from areas of lower motor vehicle ownership
to workplaces closer to train stations
from higher density residential areas
from areas around train and busway stations
to and from areas closer to city centres (except from the central city where walking takes over)
from less wealthy areas (while I haven’t tested this directly, wealth seems to explain a lot of the outliers in the scatter plots)
I’ve listed these roughly in order of the strength of the relationships seen in the data, but I haven’t put them all in a regression model (yet, sorry).
Of course most of these factors are inter-related, so we cannot isolate causation factors. I’m going to run through many of them, because they are often interesting: (note I have sometimes used log scales)
Population density is roughly related to distance from the city centre:
Motor vehicle ownership has a strong relationship with population density (see this post for more analysis):
Motor vehicle ownership has a weaker relationships with distance from the city centre:
Motor vehicle ownership is related to home distance from train stations, except in Adelaide:
Technical note: For this chart (and some below) I’ve calculated average quantities for the variable on the Y axis, as there would otherwise there are too many data points on the chart and it becomes very hard to see the relationship (I would need to show all SA1s because SA2s are too large in terms of distance from stations). The downside is that these style of charts don’t indicate the strength of relationships.
Population weighted density is related to distance from train stations, especially in Melbourne and Sydney, but not at all in Adelaide:
There is a relationship – although not strong – between weighted job density and distance from city centres:
There’s some relationship between average weighted jobs density and distance from train stations, except in Adelaide:
Here’s the same data, but as a scatter plot with a point for each destination zone, scaled by the number of journeys to each destination zone, and a linear Y-axis:
Technical note: the X-axis appears green mostly because Adelaide data points are drawn on top of other cities, but those data points aren’t of much interest.
In most cities, destination zones with high jobs density (over 700 jobs/ha) were only found within 1 km of a train station – with the notable major exception of Adelaide (again!).
(If you are curious, the large Melbourne zone at 1.4 km from a train station and 659 jobs/ha is the Parkville hospital precinct – where incidentally a train station is currently under construction).
There is a relationship between motor vehicle ownership and proximity to busway stations, but it varies between cities:
But there’s not much relationship between population density and proximity to busway stations (except in the immediate vicinity of busway stations in Brisbane):
Final remarks: there’s something about Adelaide’s train network
A few key observations come through clearly about the catchments around Adelaide’s train stations:
In aggregate they do not have higher population density, unlike other cities.
In aggregate they do not have particularly high public transport mode shares, unlike other cities.
In aggregate they do not have lower rates of motor vehicle ownership, unlike other cities.
They do not include the area of highest job density in the CBD (a longer walk or transfer to tram or bus is required), unlike other cities.
Few cities have spare land corridors available for new at-grade rapid public transport lines, and so transport planners generally want to make maximum use of the ones they’ve got, before opting for expensive and/or disruptive tunnelling or viaducts solutions. It looks like Adelaide’s rail corridors are not reaching their people-moving potential.
By contrast, Adelaide’s “O-Bahn” busway does go into the job dense heart of the CBD and the busway station catchments do have higher public transport mode share and lower motor vehicle ownership. However they do not have higher population density, possibly because the stations are surrounded by car parks, green space, and one large shopping centre (Tea Tree Plaza).
Mode shares, population densities, and motor vehicle ownership rates would quite probably change significantly if Adelaide could address the fourth issue by building a train station near the centre of the CBD.
In fact, Auckland had a very similar problem with its previous main city station being located away from the centre of the CBD. They fixed that with Britomart station opening in 2003 and train patronage soon rose quite dramatically (off a very low base, and also helped by service upgrades, subsequent electrification, and many other investments).
Should Adelaide do the same? It would certainly not be cheap and you would have to weigh up the costs and benefits.
Each year, just in time for Christmas, the good folks at the Australian Bureau of Infrastructure, Transport, and Regional Economics (BITRE) publish a mountain of data in their Yearbook. This post aims to turn those numbers (and some other data sources) into useful knowledge – with a focus on vehicle kilometres travelled, passenger kilometres travelled, mode shares, car ownership, driver’s licence ownership, greenhouse gas emissions, and transport costs.
Vehicle kilometres travelled
Road transport volumes are rising, and most of the traffic is of course cars:
Here’s the growth by vehicle type since 1971:
Light commercial vehicle kilometres have grown the fastest, curiously followed by buses (although much of that growth was in the 1980s).
Car kilometre growth has slowed significantly since 2004.
In fact, on a per capita basis car use peaked in 2004 and then declined until 2014, with a little growth since. Here’s the Australian trend (in grey) as well as city level estimates to 2015 (from BITRE Information Sheet 74):
Technical note: “Australia” lines in these charts represent data points for the entire country (including areas outside capital cities).
Darwin has the lowest average which might reflect the small size of the city. The blip in 1975 is related to a significant population exodus after Cyclone Tracey caused significant destruction in late 2014 (the vehicle km estimate might be on the high side).
Canberra, the most car dependent capital city, has had the highest average car kilometres per person (but it might also reflect kilometres driven by people from across the NSW border in Queanbeyan).
The Australia-wide average is higher than most cities, with areas outside capital cities probably involving longer average car journeys and certainly a higher car mode share.
Passenger kilometres travelled
It’s also possible to look at car passenger kilometres per capita, which takes into account car occupancy – and also includes more recent estimates up until 2017:
While car passenger kilometres per capita also peaked in 2004, they have increased slightly in recent years in Perth, Adelaide, Brisbane, and Sydney.
BITRE also produce estimates of passenger kilometres for other modes (data available up to 2017 at the time of writing).
Rail use is highest in Sydney followed by Melbourne. You can see two big jumps in Perth following the opening of the Joondalup line in 1992 and the Mandurah line in 2007.
(note: this includes both public and private bus travel)
Australia-wide bus usage is surprisingly high. While public transport bus service levels and patronage would certainly be on average low outside capital cities, buses do play a large role in carrying children to school – particularly over longer distances in rural areas. The peak for bus usage in 1990 may be related to deregulation of domestic aviation, which reduced air fares by around 20%.
Darwin saw a massive increase in bus use in 2014 thanks to a new nearby LNG project running staff services, while investments in increased bus services in Melbourne and Brisbane in the first decade of this century led to significant patronage growth.
We can sum all of the mass transit modes (I use the term “mass transit” to account for both public and private bus services):
We can also calculate mass transit mode share of motorised passenger kilometres (walking and cycling kilometres are unfortunately not estimated):
Sydney has maintained the highest mass transit mode share, while Melbourne made significant gains between 2005 and 2009, and Brisbane also grew strongly 2007 to 2013.
Here’s how car and mass transit passenger kilometres have grown since car used peaked in 2004:
Mass transit use has grown much faster than car use in Australia’s three largest cities. In Sydney and Melbourne it has exceeded population growth also.
Mass transit has also outpaced car use in Perth, Adelaide, and Hobart:
In Canberra, both car and mass transit use has grown much slower than population, and it is the only city where car growth exceeded public transport growth between 2004 and 2017.
Car ownership
The ABS regularly conduct a Motor Vehicle Census, and the following chart includes data up until January 2018.
Technical note: Motor Vehicle Census data (currently conducted in January each year) has been interpolated to produce June estimates for each year.
Thanks to BITRE Information Sheet 84, here is motor vehicle licence ownership per 100 persons (of any age) going back to 1971:
Technical note: the ownership rate is calculated as the sum of car, motorbike and truck licenses – including learner and probationary licences, divided by population. Some people have more than one driver’s licence so it’s likely to be an over-estimate of the proportion of the population with a licence.
There’s been slowing growth over time, but Victoria has seen slow decline since 2011.
Here’s a breakdown by age bands (note each chart has a different Y-axis scale):
Motor vehicle licence ownership rates have increased for people over 70 (presumably due to a healthier ageing population), and declined for people under 30.
Licencing rates for teenagers have been trending down in South Australia and Victoria recently, but not in other states:
The trends are mixed for 20-24 year-olds:
New South Wales and Victoria are seeing downward trends in the 25-29 age bracket:
Licencing rates for people in their 70s are rising in all states (I suspect a data error for South Australia in 2016):
A similar trend is clear for people aged 80-89 (Victoria was an anomaly before 2015):
Australia’s domestic non-electric transport emissions have increased steadily since 1990 and show no signs of slowing down, let alone declining (latest data at the time of writing is up to June 2018):
Depending on how you disaggregate total emissions, transport is the second largest sector and the fastest growing.
Here’s breakdown of transport emissions (detailed data only available to 2016 at time of writing):
And the growth in each sector since 1990:
Domestic aviation has had the fastest growth, followed by buses. In more recent years rail emissions have grown strongly (note: most of this is rail freight as the vast majority of passenger train movements are electric). Car emissions have grown 27%, but make up the largest share of transport emissions.
Here are per capita transport emissions for each state:
The data is a bit noisy (largely due to fluctuations in aviation emissions). Here are road emissions per capita:
In 2016 there were sharp increases in Western Australia, Queensland and the Northern Territory, while most other states appear to be on a downward trend.
Car emissions per capita have been generally trending downwards in most states, again except Queensland, Western Australia, and the Northern Territory:
Of course if we are to avoid dangerous climate change, total emissions need to reduce substantially, not just per capita emissions!
It’s possible to combine data sets to estimate average emissions per vehicle kilometre for different vehicle types:
It’s difficult to see any significant reductions in emissions intensity, while average bus emissions intensity has increased recently (not sure why). Average car emissions have fallen slightly from 281 g/km in 1990 to 244 g/km in 2016.
However, the above figures don’t take into account the average passenger occupancy of vehicles. To get around that we can calculate average emissions per passenger kilometre for the high person-capacity modes:
Of course the emissions per passenger kilometres of a bus or plane will depend on occupancy – a full aeroplane or bus will have likely have significantly lower emissions per passenger km. Indeed, the BITRE figures imply an average bus occupancy of around 9 people (typical bus capacity is around 60) – so a well loaded bus should have much lower emissions per passenger km. The operating environment (city v country) might also impact car and bus emissions. On the aviation side, BITRE report a domestic aviation average load factor of 78% in 2016-17.
Cost of transport
The final topic for this post is the real cost of transport. Here are headline real costs (relative to CPI) for Australia:
Technical note: Private motoring is a combination of factors, including motor vehicle retail prices and automotive fuel. Urban transport fares include public transport as well as taxi/ride-share.
The cost of private motoring has tracked relatively close to CPI, although has been trending down since around 2008. The real cost of motor vehicles has plummeted since 1996. Urban transport fares have been increasing faster than CPI since the late 1970s.
Here’s a breakdown of the real cost of private motoring and urban transport fares by city (note different Y-axis scales):
Urban transport fares have grown the most in Brisbane, Perth and Canberra – relative to 1973.
However if you choose a different base year you get a different chart:
What’s most relevant is the relative change between years – eg. you can see Brisbane’s experiment with high urban transport fare growth between 2009 and 2017 in both charts.
To illustrate the data visualisation problem of choosing a base year – here is the same data for every base year between 1973 and 2018:
Hopefully this post has provided some useful insights into transport trends in Australia. A future post might examine the relationships between the data sets further.
The location of population growth has a big impact on transport outcomes. It’s also interesting in its own right. So where is Australia’s population growing?
This post primarily uses the ABS’s Regional Population Growth data set, which is the highest resolution geography level for which per-year population estimates are published and the data series goes back to 1991.
Population growth by part of Australia
At the top level I’ve divided Australia’s population into those living within:
Capital cities – defined by Greater Capital City Statistical Areas (GCCSA)
Large regional cities – defined as Significant Urban Areas (SUA) (2011 boundaries) with more than 100,000 population in 2011 – the smallest city qualifying being Toowoomba, the largest city not qualifying being Ballarat
Small regional cities – all other Significant Urban Areas with at least 10,000 population (in 2011)
Elsewhere – ie smaller towns and rural areas
Here’s the history of Australia’s population and growth since 1991, by these four categories:
While the capital cities have seen the largest absolute growth, the large regional cities have seen the highest percentage growth.
Here is the annual population growth by each category:
The capital cities have dominated the quantity of population growth, particularly since around 2007, with “elsewhere” having very small net growth in recent years. But as the first chart showed, large regional cities have had the fastest percentage growth – so it all depends on how you want to think about “growth”!
The distribution of total population across the four categories has very slowly shifted towards capital cities:
So what proportion of Australians live in urban areas?
Here’s a breakdown of Australia’s population from the 2016 census by size of city/town and rural areas (using urban centre and locality boundaries – different to the above analysis):
The United Nations cannot land on a single definition of urban (is a locality of 100 people urban?) so it’s hard to perfectly answer the question. But I can say: well over 90% of Australians live in urban areas.
Dominance of capital cities within states and territories
In all states, capital cities have been increasing their share of the population:
The blip in the Northern Territory represents a temporary exodus of population after Cyclone Tracy devastated much of Darwin on Christmas Day 1974.
Population growth of cities
The following chart shows the population of capital cities and large regional cities. Note I’ve again used a log scale on the Y-axis to separate the cities.
You can see the Gold Coast and Sunshine Coasts have overtaken several other cities.
Here’s a longer time series history of the capital cities (this time not a log scale):
Technical note: Historical population estimates on Greater Capital City Statistical Area boundaries are only available back to 1971, and for Significant Urban Areas boundaries back to 1991. Estimates for earlier years are on inconsistent boundaries.
Perth overtook Adelaide in 1984, and Canberra overtook Hobart in 1972.
Here is the percentage population growth since 1971 for capitals:
And for more recent history, here is the percentage population growth since 2001 for capital and large regional cities:
The Gold and Sunshine Coasts are the fastest growing cities by far, followed by Cairns, Brisbane and Perth. Hobart and Adelaide are the slowest growing capital cities.
Another view is annual growth rates:
In 2017, Melbourne had the fastest population growth rate, and Adelaide the slowest. The Gold and Sunshine Coasts have had relatively high growth since 1991. All cities have fluctuated a fair bit over time.
Here’s the annual population change for each city – again on a log scale Y-axis:
Technical note: because of the log scale, negative values are omitted from the chart.
Melbourne has been adding more people than Sydney every year since 2002 (hence predictions it will become Australia’s largest city), while Perth’s recent strong growth spurt ran between 2006 and 2013.
Here’s a simple map of Australian cities and towns by size (based on 2016 GCCSA and SUA boundaries, which is different to the time series data shown above):
Note: the intervals are arbitrary and it’s hard to get them perfect. For example, Ballarat had 103,581 residents and Bendigo 97,470 (in 2017), so they are coloured differently. Note: Ballarat had less than 100,000 residents in 2011 so was not included in the earlier charts for regional cities.
Also many of these SUAs include a lot of hinterland – eg Geelong includes Torquay
Here is a similar map, but colours now indicate percentage population change 2001 to 2017:
The city or town with the highest percentage growth is Bussleton in WA (+66%), followed by Hervey Bay in Queensland (+58%). Broken Hill (NSW) has seen the biggest population decline (-15%), followed by Mount Isa in Queensland (-7%).
Where is population growing within larger cities?
Melbourne
Firstly, my home town Melbourne. Here’s the population growth in the five years to 2017:
Technical note: I’ve used point circles for each SA2, rather than fill colour (which should never be used for non-ratio data because the size of the zone can too easily distort the message!). Alternatives are to show population density, population growth density, or growth rate percentages. However some metro fringe SA2s include a relatively small urban area coupled with a large rural area, so the density gets washed out by the rural area. Growth rate percentages also depend a lot on the population in the base year. If an SA2 goes from 2000 residents to 8000 residents the growth rate is 300%, but that’s the same increase as a SA2 that goes from 30,000 to 36,000 (20%).
Melbourne’s SA2s (on 2016 boundaries) with the largest population growth were in the outer west, outer north, outer south-east, and central city. SA2s with population slight decline were Rowville South, Upwey – Tecoma, Endeavour Hills South, Keilor Downs, Taylors Lakes and Mill Park.
I think it’s also important to note that SA2 boundaries are somewhat arbitrary and they only change every five years.
In fact, South Morang was reported by the ABS (and media) as the fastest growing SA2 in Australia in 2015-16 (on 2011 boundaries) in terms of absolute growth, but by then it had 64,354 residents and was by far the largest SA2 in Australia (the next largest, Point Cook, had 52,253). It was time to split into smaller SA2s – which indeed happened shortly thereafter with the new 2016 boundaries (ditto Point Cook). So it was probably the fastest growing SA2 more because the ABS had not yet split it into smaller SA2s. Unfortunately this issue isn’t always picked up by the ABS and the media.
How has population growth changed over the years? That is a four-dimensional question, so my answer will be a four-dimensional visualisation. Here’s an animated map showing the annual growth for each SA2 for each year 1992 to 2017 (you might need to click to enlarge to see it clearly):
Technical note: until 2001 the maps shows SA2s on 2011 boundaries and then from 2002 onwards the map shows 2016 boundaries. There were several SA2s that split with the 2016 boundaries, mostly in the northern suburbs.
While there has been fairly consistent growth on the fringe in all years, the amount of growth in established areas has fluctuated over time. Here’s a summarised view of the same data, but simplifying the geographic element to distance from the CBD:
You can see many of Melbourne’s middle suburbs (particularly 10-15 km) saw population decline around 1992 to 1995 while Victoria was under economic stress (but also Australia’s total population growth rate fell below 1% during this period).
Most of Melbourne’s outer growth areas are 20+ km from the CBD, and you can see reasonably steady growth in bands that far out and beyond. But within 20 km there was a big population growth slow-down in 2010 and 2011.
Sydney
Here are the same two charts for Sydney:
Sydney’s population growth has also varied considerably between years, but the most consistent band for population growth is within 5 km of the CBD. Population growth in the inner and middle suburbs has been strong since 2007.
Brisbane
Brisbane seems to have been a mixed bag. There’s been growth on the fringe to the north and south-west. From around 2002 there was an increase in central city population growth, with a particularly strong surge in 2003 and 2017.
Perth
Perth is an interesting story. Apart from the mining boom years 2007 to 2013, most of the population growth has been through urban sprawl. During the mining boom the central and inner suburbs saw substantial population growth (along with the fringe), but since 2014 that’s crashed and there was substantial population decline in the inner and middle suburbs, particularly 10-15 km out from the CBD in 2016.
Adelaide
Adelaide saw substantial population decline in the inner suburbs in the early 1990s, with instead sprawl to the south and north. Things were quieter around the turn of the century before population growth rose around 2005, with quite significant inner suburban population growth, but still plenty of sprawl on the fringe.
Canberra
In the early 1990s, population growth was mostly in the far north and south. Then at the turn the century the south quietened down and Queanbeyan West – Jerrabomberra had a growth spurt. Growth in the outer north took off around 1995. Infill growth took off around 2007, particularly in Belconnen, Bruce, Civic and Kingston – Barton. And then from around 2014 a brand new growth front opened in the west (Wright and Coombs).
Hobart
Note: I’ve used a different scale for the bubbles. because of the smaller changes and smaller geography.
Hobart had net population decline in the late 1990s but then grew quickly from 2003 onwards, with particularly strong growth in 2009 and 2017. The majority of population growth in recent years has been within 10km of the CBD.
Population growth in regional areas
Here is a map showing population growth percentage from 2001 to 2017 for all SA2s in Australia:
No, a new gigantic dense rectangular city has not emerged in the north-west of Western Australia. That’s an artefact of coloured maps and large geographic zones. The “East Pilbara” SA2 population simply grew from 2441 to 6789, which is 178% growth. But the 2017 average density was 0.00017 persons per hectare.
Otherwise places of higher percentage growth are mostly around the major cities. Population decline is common in most inland/outback areas.
I hope this has provided you some new insights on population growth around Australia.
My next post will look at the urban growth areas of large cities in more detail.
Many people talk about urban growth in Australian cities being car-dependent low-density suburban sprawl. But how true is that in more recent times? Are new greenfield density targets making a difference? Are cities growing around their rapid public transport networks? And how do growth areas compare to established areas at a similar distance out from city centres?
This post takes a look at what census data can tell us about outer urban growth areas in terms of population density, motor vehicle ownership, distance from train/busway stations, and journey to work mode shares.
How much of city population growth is in outer areas?
Firstly a recap, here is the percentage of annual population growth in each city that has occurred in “outer” areas (defined by groupings of SA3s around the edges of cities – refer my previous post for maps showing outer areas) for Greater Capital City Statistical Areas.
Sydney has had less than a third of its population growth in outer areas since around 2003, while Perth has mostly had the highest outer growth percentage (since 1996), and more recently pretty much all population growth in Perth has been on the fringe. You can see how the other cities sit in between.
However, not all of this “outer” population growth was in urban growth on the fringe. For that we need to distinguish between urban growth and infill development, even in “outer” areas. So we really need a better definition of outer growth areas.
How to define outer urban growth areas
I have built groupings of SA1s (Statistical Area Level 1) that try to represent outer urban greenfield residential development. SA1s are the smallest census geographic areas (average population 400) for which all census data variables are available.
I’ve selected 2016 SA1s that meet all of the following criteria:
Brand new SA1 or significant population growth: The 2016 SA1 is new and cannot be matched to a 2011 SA1 (by location/size and/or ABS correspondences), or if it can be matched, the population at least doubled between 2011 and 2016. Brand new SA1s are very common in urban growth areas as new SA1s are created to avoid oversized SA1s on last census boundaries (except this doesn’t always happen – more on that shortly).
In an SA2 with significant population growth: The SA2 (Statistical Area Level 2 – roughly suburb sized with typically 3,000 to 25,000 residents) that contains the SA1 had population growth of at least 1000 people between 2011 and 2016 (based on 2016 boundaries). That is, the general area is seeing population growth, not just one or two SA1s.
Are on – or close to – the urban fringe. I’ve filtered out particular SA2s that I’ve judged to be contain all or mostly in-fill development rather than greenfield development, or that are largely surrounded by existing urban areas and are not close to the urban fringe. I’ll be the first to admit that some of the inclusions/exclusions are a little arbitrary.
The criteria aren’t perfect, but it seems to work pretty well when I inspect the data. I’m calling these “Growth SA1s” or outer urban growth in this post.
For urban centres, I’m using Significant Urban Area 2016 boundaries (rather than Greater Capital City boundaries), and I’ve bundled Yanchep with Perth, Melton with Melbourne, and the Sunshine Coast and Gold Coast with Brisbane to form South East Queensland (SEQ).
Where are these outer urban growth areas?
What follows are maps for each city with the density of these growth SA1s shown by colour.
Melbourne’s northern and western growth areas:
Technical note: The maps do not show non-growth SA1s with fewer than 5 people per hectare, or “growth SA1s” with fewer than 1/hectare, although these SA1s are including in later analysis.
And the south of Melbourne:
Note: not shown on these Melbourne maps are isolated tiny growth SA1s in Rosebud and Mooroolbark.
Here are Sydney’s growth SA1s – all in the western suburbs:
Next up South East Queensland, starting in the north with the Sunshine Coast:
Northern Brisbane:
Outer urban growth is scattered in southern Brisbane and northern Gold Coast:
Gold Coast – Tweed Heads:
Perth’s northern and eastern growth areas:
Perth’s southern growth areas:
Note: Canning Vale East is an inclusion you could debate – the previous land use of the growth SA1s appear to have been rural based on satellite imagery.
Northern Adelaide:
Southern Adelaide:
And finally Canberra:
So how much of each cities’ population growth has been in outer growth areas?
Here’s a breakdown of the population growth for my six urban areas:
Over the five-year period, outer urban growth areas accounted for 19% of Sydney’s population growth, 43% of Melbourne’s, 37% of SEQ’s, 60% of Perth’s, 27% of Adelaide’s and 69% of Canberra’s.
Technical note: These “outer urban growth” figures are different to the chart at the top of this post which had a coarser definition of “outer” and used Greater Capital City boundaries. Some of my “outer urban growth” areas actually don’t quality as “outer” in the coarser definition, and I’ve also excluded several “outer” SA2s from “outer urban growth” where I’ve deemed the growth to be mostly infill. Hence the differences.
In case you are wondering, it’s not easy to create a longer-term time-series analysis about the proportion of population growth in “outer urban growth” areas because the classification of SA2s would have to change on a year-by-year basis which would be messy and somewhat arbitrary.
A challenge for density analysis: some SA1s are over-sized
You might have noticed some SA1s in the maps above are very large and show a low average density of 1-5 persons per hectare (I’ve coloured them in a light cyan). Many of these SA1s had thousands of residents in 2016, which is way more than the ABS guideline of 200 to 800 residents. Unfortunately what seems to have happened for 2011 and 2016 in some cities is that the ABS did not create enough SA1s to account for new urban areas. Some Melbourne SA1s had a population over 4000 in 2016. Many of these SA1s contain a combination or urban and rural land use, so their calculated density is rather misleading.
I’m designating any SA1s with more than 1000 residents and larger than 100 hectares as “oversized”, and I’ve exclude these from some density analysis below. Here’s a chart showing the proportion of outer growth area populations that are in oversized SA1s:
You can see it is a substantial problem in Sydney, Melbourne, Perth and South East Queensland, but miraculously not a problem at all in Adelaide or Canberra (I’m sure someone in ABS could explain why this is so!).
If you are interested, in 2011 it was a bigger problem in Melbourne, and only Canberra was fully clean.
So how dense are outer urban growth areas?
Firstly, I am excluding over-sized SA1s from this analysis for the reasons just mentioned.
Secondly, all cities will also have growth areas that were partially developed at the time of the census (ie some lots with occupied houses and other lots empty) so the densities measured here may be understated of the likely fully built-out density of these SA1s. That said, those areas perhaps are more likely to be in over-sized SA1s, but it’s hard to be sure. So keep this in mind when looking at growth area densities.
You can see dramatic differences, with Sydney, Canberra, and Melbourne showing higher densities, and South East Queensland with much lower densities. As we saw on the maps above, South East Queensland’s outer growth areas are very dispersed, so perhaps more of them are growing slowly and more of them are partially built-out? It’s hard to be sure.
But perhaps what is most remarkable is that Canberra had the highest densities in outer urban growth areas of any city – nothing like what you might consider suburban sprawl. Here’s what was 144.5 people per hectare in 2016 in Wright on Canberra’s new western growth front looks like:
The densest SA1 in Sydney’s growth areas was 101 persons/ha. Nothing like this was seen in other cities.
Canberra’s outer growth areas are actually, on average, denser than the rest of Canberra (on a population weighted density measure):
The same was also true by a slim margin in both Perth and Adelaide, but they have relatively “suburban” densities for both growth and established areas. The growth areas of Sydney and Melbourne are more dense than Perth and Adelaide, but not compared to the rest of these cities as a whole. That’s probably got to do a lot with the large cities having dense inner suburbs.
So perhaps it is better to compare the urban growth areas with established areas a similar distance from city centres, which the following chart does (I’ve filtered out 5 km distance intervals without growth areas of at least 2000 population, and apologies for rather squashed Canberra label):
Technical note: for South East Queensland I’ve measured distances from the Brisbane CBD.
Outer growth areas were much more dense than the rest of each city at most distances from the city centre, except in Sydney.
One issue with the above chart is that different distance intervals have different populations – for example only 2,815 people were in growth SA1s at a distance of 45-50 km from the Perth CBD (just above my threshold of 2000), so the low population density of that interval is not hugely significant.
To get around that issue, I’ve calculated the overall population weighted density of non-growth SA1s that are within these 5 km distance intervals from the CBD (including all of SEQ beyond 15 km from the CBD). The following chart compares those calculations with the population weighted density of the growth areas overall:
This shows that urban growth areas are on average more dense than other parts of the city at similar distance from the CBD, except in South East Queensland. And remember, many of the growth SA1s will be partially built out, so their expected density is understated.
Are outer urban growth areas near rapid public transport?
The next chart shows the proportion of growth SA1 population by distance from the nearest train or busway station:
Technical notes: Distances are measured from the centroid of each SA1 to a point location defined for each station (sourced from August 2016 GTFS feeds). For oversized SA1s these distances might be a little longer than reality for the average resident. I haven’t excluded oversized SA1s because I want to see the population alignment of growth areas overall. Canberra excluded due to lack of separated rapid transit.
What sticks out clearly is that just over half the of the population in Perth’s outer growth areas was more than 5 km from a station in 2016. That is to say Perth has had the least alignment of outer urban growth areas and rapid public transport networks of all five cities. I’m not sure many urban planners would recommend such a strategy.
However, Perth’s MetroNet program appears to be trying to rectify this with new lines and stations proposed near urban growth areas such as Yanchep, Canning Vale East, Ellenbrook, Byford, and Karnup (Golden Bay). It will however take some time to get to them all built and open.
South East Queensland was second to Perth in terms of urban growth remote from stations, with a lot of the growth scattered rather than concentrated around rail corridors. I haven’t included the Gold Coast light rail in my proximity calculation – it runs at an average speed of 27 km/h (which is slower than most train networks) and doesn’t serve outer urban growth areas.
Sydney and Adelaide had the highest proximity of growth areas to stations.
Around half of Melbourne’s growth SA1s that were more than 5km from a train station were in Mernda and Doreen, a corridor in which a rail extension opened in 2018. Many of the rest are not in the current designated growth corridors, or are where future train stations are planned. Melbourne’s current designated urban growth corridors are fairly well aligned to its train network. From a transport perspective this is arguably a better kind of sprawl than what Perth has been experiencing.
Adelaide’s outer growth areas more than 5 km from a station were in Mount Barker (satellite town to the east) and Aldinga (on the far south coast of Adelaide).
Are the outer urban growth areas better aligned to rapid public transport stations than non-growth areas at the same distance from city centres? Here’s the chart as above but with an extra column for non-growth areas within the same distance intervals from the CBD (as before).
The populations of urban growth areas are less likely to be within a couple of kilometres of a station (most of that land probably has long-established urban development), but curiously in Adelaide and South East Queensland the urban growth areas are more likely to be within 5 kilometres of a station than the non-growth areas, suggesting better rapid public transport alignment than older urban growth areas. Older urban areas in other cities are more closely aligned to stations, particularly in Perth.
As an interesting aside, here’s a breakdown over the last three censuses of population by distance from train/busway stations (operational in 2016 – so it overstates 2006 and 2011 slightly):
You can really see how Perth has had much population growth remote from its rapid public transport network, which probably goes some way to explaining the overall 1.2% journey to work mode shift towards private transport between 2011 and 2016.
So how did people in these outer growth areas get to work?
Technical note: The figures here for “private transport” are for journeys involving only private transport modes – i.e. they exclude journeys involving both private and public transport (eg car+train).
While private transport (mostly car driver only journeys) dominated journeys to work from almost all growth areas, Melbourne and Sydney were the only cities to see significant numbers of residents in outer growth areas with private transport mode shares below 80%.
South East Queensland’s outer urban growth areas were the most reliant on private transport to get to work, with an overall private transport mode share of 93%, followed by Adelaide on 92%, Canberra on 91%, Perth on 90%, Melbourne on 86%, and Sydney on 81%.
Here’s how the growth area mode shares compare to other areas a similar distance from city centres (note: the Y-axis is not zero-based):
Significantly, the growth areas of Sydney and Melbourne had lower private transport mode shares of journeys to work than other parts of the city a similar distance out – even though they are generally further away from train or busway stations (as we saw above)! That’s not to say they didn’t drive themselves to a train station to get to work.
Similar to population density, here is a summary of growth areas compared to other areas in the same distance interval from the CBD:
There’s really not a huge amount of difference within cities. Sydney’s growth areas had a mode share 1.5% lower than non-growth areas, while Canberra’s growth areas had a mode share 2.5% higher.
What are motor vehicle ownership rates like in the outer growth areas?
My preferred measure is household motor vehicles per persons aged 18-84 (roughly people of driving age).
Motor vehicle ownership rates are generally very high across the growth areas – with the notable exceptions of Melbourne and Canberra where around a quarter of the growth area population had a motor vehicle ownership rate of less than 80 (although that is still pretty high!). (I explored this in more detail in an earlier post on Melbourne)
South East Queensland, Perth, and Adelaide outer urban growth areas had the highest motor vehicle ownership rates. Perth’s urban growth areas overall averaged 96.7 motor vehicles per persons aged 18-84 – pretty close to saturation.
How does motor vehicle ownership compare to established areas a similar distance from the city centre? The following chart compares motor vehicle ownership between urban growth and other areas at the same distance from the CBD (note: the Y-axis is not zero-based):
Motor vehicle ownership tends to increase with distance from the CBD, and in Sydney and South East Queensland the growth areas have higher ownership compared to non-growth areas. But the opposite is true in Melbourne, Perth and Canberra.
The population at each distance interval varies considerably, so here is a summary of the data across all distance intervals that have growth SA1s for each city:
The growth areas of Melbourne, Perth and Canberra had slightly lower motor vehicle ownership than other areas a similar distance from the city, while the opposite was true in other cities. That said, motor vehicle ownership rates are very high across all cities.
How does motor vehicle ownership relate to distance from stations?
Technical note: for scatter plots I’ve filtered out SA1s with less than 50 population as they are more likely to have outlier results (one person can change a measure by 2% or more).
Lower rates of motor vehicle ownership are generally only found close to train/busway stations (and are dominated by Melbourne examples), but close proximity to a station does not guarantee lower rates of motor vehicle ownership. Quite a few Adelaide SA1s are found the top middle part of the chart – these are all in Mount Barker which has frequent peak period express buses to the Adelaide CBD operating along the South East Freeway – which is similar to rapid transit although without a dedicated right of way.
How do journey to work mode shares relate to distance from stations?
Here’s a scatter plot of private transport mode shares of journeys to work and distance from train/busway station:
This shows that lower private transport mode shares are only generally seen within proximity of train or busway stations, and areas remote from stations are very likely to have high private transport mode shares. But also that proximity to a station does not guarantee lower private transport mode shares of journeys to work (particularly in SEQ).
Technical aside: You might have noticed that almost no SA1s report 99% private mode share. How can that be? The ABS make random adjustments to small figures to avoid identification of individuals which means you never see counts of 1 and 2 in their data. To get a mode share of 99% you’d need at least 300 journeys to work with “3” being non-private (or a similar but larger ratio). Very few SA1s have 300+ journeys to work, and even for over-sized SA1s, they are very unlikely to have only 3 or 4 non-private journeys to work. A mode share of 100% is much easier because you can get that no matter the total number of journeys.
How does population density relate to distances from train/busway stations?
Densities above 45 persons/ha were mostly only found within 5 km of stations, and almost entirely in Sydney and Melbourne. The highest densities were very close to train stations in Sydney. In the middle area of the chart you can see quite a few Perth SA1s that are around 30-40 persons/ha but remote from stations. These are all in the Ellenbrook area of Perth’s north-east, generating a lot of car traffic.
How does motor vehicle ownership relate to private transport mode shares of journeys work to work?
For interest, here is the relationship as a scatter plot:
There is certainly a relationship, but it’s not strong (r-squared = 0.22). Other factors are at play.
Conclusions
Perth and Canberra are seeing most of their population growth on the fringe, with Sydney, Adelaide, Melbourne, and South East Queensland seeing most of their population growth in established areas.
Growth areas in Sydney, Melbourne, and Canberra have higher than traditional urban densities, indeed Sydney and Canberra have a few very high density greenfield developments. Perth, Adelaide, and particularly South East Queensland have urban growth at relatively low densities. In fact, SEQ is the only major urban centre where growth areas are measured as less dense than non-growth areas at similar distances from the CBD.
Perth’s urban growth areas are largely remote from rapid transit stations, and this is likely contributing directly to very high and increasing rates of motor vehicle ownership and private transport mode shares. Melbourne’s current urban growth corridors are closely aligned to train stations (thanks to the opening of the Mernda line), and this is also largely true of Sydney and Adelaide.
Almost all outer urban growth areas had high rates of motor vehicle ownership. Overall, Melbourne, Perth, and Canberra’s outer urban growth areas had slightly lower rates of motor vehicle ownership compared to other areas at the same distance from the CBD. Only Sydney, Melbourne and Canberra have some growth areas with lower motor vehicle ownership and/or lower private transport mode shares of journeys to work – and these were all close to train or busway stations.
I hope you’ve found this at least half as interesting as I have.
My last post showed half of Perth’s outer urban population growth between 2011 and 2016 happened in places more than 5 km from a train station (see: Are Australian cities sprawling with low-density car-dependent suburbs?). It’s very car-dependent sprawl, with high levels of motor vehicle ownership (96 per 100 persons aged 18-84) and high private transport mode share of journeys to work (88%).
But what about population growth overall in cities? Is most growth happening close to rapid transit stations? How are cities orientated to rapid transit overall? And how does rapid transit orientation relate to mode shares?
Let’s dive into the data to find out.
Why is proximity to rapid transit important?
Public transport journey to work mode shares are generally much higher close to stations:
And motor vehicle ownership rates are generally lower closer to stations:
However it is worth noting that the proximity impact wears off mostly after only a couple of kms. Being 2-5 kms from a station is only useful if you can readily access that station – for example by bus, bicycle, or if you are early enough to get a car park.
Also, proximity to a station does not guarantee lower car dependence – the rapid transit service has to be a competitive option for popular travel destinations. I’ve discussed the differences between cities in more detail (see: What explains variations in journey to work mode shares between and within Australian cities?), and I’ll a little have more to say on this below.
But in general, if you want to reduce a city’s car dependence, you’ll probably want more people living closer useful rapid public transport.
Is population growth happening near train/busway stations?
The following chart (and most subsequent charts) are built using ABS square kilometre grid population data for the period 2006 to 2018 (see appendix for more details).
Melbourne has seen the most population growth overall, followed by Sydney and Brisbane. Population growth in Perth has slowed dramatically since 2014, and has been remained slow in Adelaide.
Population growth in areas remote from stations most cities has been relatively steady. By contrast, the amount of population growth nearer to stations fluctuates more between years – there was a noticeable dip in growth near stations around 2010 and 2011 in all cities.
You can also see that in recent years the majority of Perth’s population growth has been more than 5 km from a station.
To show that more clearly, here’s the same data, but as a proportion of total year population growth:
You can see that most of Perth’s population growth has been remote from stations. In the year to June 2016, 85% of Perth’s population growth was more than 5 km from a train station (the chart actually goes outside the 0-100% range in 2016 because there was a net decline in population for areas between 2 and 4 km from stations). That was an extreme year, but in 2018 the proportion of population growth beyond 5 km from a station had only come down to 57.5%. That is not a recipe for reducing car dependence.
At the other end of the spectrum, almost half of Sydney’s population growth has been within 1 km of a train or busway station. No wonder patronage on Sydney’s train network is growing fast.
Melbourne has had the smallest share of population growth being more than 5 km from a station over most years since 2006. The impact of the South Morang to Mernda train line extension, which opened in August 2018, won’t be evident until the year to June 2019 data is released (probably in March 2020). Melbourne’s planned outer growth corridors are now largely aligned with the rail network, so I would expect to see less purple in upcoming years.
Here’s the same data for the next largest cities that have rapid transit:
Gold Coast – Tweed Heads has seen the most population growth, followed by the Sunshine Coast and more recently Geelong population growth has accelerated.
The Sunshine Coast stands out as having the most population growth remote from rapid transit (a Maroochydore line has been proposed), while Wollongong had the highest share of population growth near stations.
What about total city population?
The above analysis showed distances from stations for population growth, here’s how it looks for the total population of the larger cities:
Sydney has the most rapid transit orientated population, with 67% of residents within 2 km of a rapid transit station. Sydney is followed by Melbourne, Brisbane, Adelaide, and then Perth.
The most spectacular step change was in Perth in 2008, following the opening of the Mandurah rail line in the southern suburbs. This brought rail access significantly closer for around 18% of the city’s population. However, Perth has since been sprawling significantly in areas remote from rail while infill growth has all but dried up in recent years. 22% of the June 2018 population was more than 5 km from a train station, up from 19% in 2008. But it’s still much lower than 37% in 2007. Perth remains the least rapid transit orientated large city in Australia.
Brisbane has also seen some big step changes with new rail lines to Springfield (opening December 2013) and Redcliffe Peninsula (opening October 2016).
Several new station openings around Melbourne have kept the overall distance split fairly stable – that is to say the new stations have been just keeping up with population growth. The biggest noticeable step change was the opening of Tarneit and Wyndham Vale stations in 2015.
Adelaide’s noticeable step change followed the Seaford rail extension which opened in February 2014.
Sydney’s step change in 2007 was the opening of the North West T-Way (busway). The opening the Leppington rail extension in 2015 is also responsible for a tiny step (much of the area around Leppington is yet to be developed).
Here are the medium sized cities:
Woolongong is the most rapid transit orientated medium sized city, followed by Geelong and Newcastle.
In the charts you can see the impact of the Gold Coast train line extension to Varsity Lakes in 2009, the truncation of the Newcastle train line in 2014 and subsequent opening of “Newcastle Interchange” in 2017, and the opening of Waurn Ponds station in Geelong in 2015.
Average resident distance from a rapid transit station
Here’s a single metric that can be calculated for each city and year:
Many cities have barely changed on this metric (including Melbourne which has had a reduction of just 26 metres between 2006 and 2018). Brisbane, Perth and the Gold Coast are the only cities to have achieved significant reductions over the period.
It will be interesting to see how this changes with new rail extensions in future (eg MetroNet in Perth), and I’ll try to update this post each year.
How strong is the relationship with public transport mode shares at a city level?
Here is a comparison between average population distance from a train/busway station, and public transport mode share of journeys to work, using 2016 census data:
In particular, Newcastle, Geelong, and Wollongong have relatively low public transport mode shares even though they have high average proximity to rapid transit stations.
Most journeys to work involving train from these smaller cities are not to local workplaces but to the nearby capital city, and those long distance commutes make up a relatively small proportion of journeys to work.
Here are some headline figures showing trains have minimal mode share for local journeys to work in the smaller cities:
City
Train mode share for intra-city journeys to work
Train mode share for all journeys to work
Gold Coast
0.6%
2.2%
Sunshine Coast
0.1%
0.8%
Newcastle
0.5%
1.0%
Wollongong
1.2%
4.9%
Central Coast
1.2%
9.3%
Geelong
0.5%
4.5%
Appendix: About the data
I’ve used ABS’s relatively new kilometre grid annual population estimates available for each year from June 2006 onwards (to 2018 at the time of writing), which provides the highest resolution annual population data, without the measurement problems caused by sometimes irregularly shaped and inconsistently sized SA2s.
I’ve used train and busway station location data from various sources (mostly GTFS feeds – thanks for the open data) and used Wikipedia to source the opening dates of stations (that were not yet open in June 2006). I’ve mostly ignored the few station closures as they are often replaced by new stations nearby (eg Keswick replaced by Adelaide Showgrounds), with the exception of the stations in central Newcastle.
As with previous analysis, I’ve only included busways that are almost entirely segregated from other traffic.
I also haven’t included Canberra as it lacks an internal rapid transit system (light rail is coming soon, although it will have an average speed of 30 km/h – is that “rapid transit”?).
Distances from stations are measured from the centroid of the grid squares to the station points (as supplied) – which I have segmented into 1 kilometre intervals. Obviously this isn’t perfect but I’m assuming the rounding issues don’t introduce overall bias.
Here’s what the Melbourne grid data looks like over time. If you watch carefully you can see how the colours change as new train stations open over time in the outer suburbs:
On this map, I’ve filtered for grid squares that have an estimated population of at least 100 (note: sometimes the imperfections of the ABS estimates mean grid squares get depopulated some years).
Finally, I’ve used Significant Urban Areas on 2016 boundaries to define my cities, expect that I’ve bundled Yanchep into Perth, and Melton into Melbourne.
While Australian cities are growing outwards, densities are also increasing in established areas, and newer outer growth areas are some times at higher than traditional suburban densities.
So what’s the net effect – are Australian cities getting more or less dense? How has this changed over time? Has density bottomed out? And how many people have been living at different densities?
This post maps and measures population density over time in Australian cities.
I’ve taken the calculations back as far as I can with available data (1981), used the highest resolution population data available. I’ll discuss some of the challenges of measuring density using different statistical geographies along the way, but I don’t expect everyone will want to read through to the end of this post!
[This is a fully rewritten and updated version of a post first published November 2013]
Measuring density
Under traditional measures of density, you’d simply divide the population of a city by the area of the metropolitan region.
At the time of writing Wikipedia said Greater Sydney’s density was just 4.23 people per hectare (based on its Greater Capital City Statistical Area). To help visualise that, a soccer pitch is about 0.7 hectares. So Wikipedia is saying the average density of Sydney is roughly about 3 people per soccer field. You don’t need to have visited Sydney to know that is complete nonsense (don’t get me wrong, I love Wikipedia, but it really need to use a better measure for city density!).
The major problem with metropolitan boundaries – in Australia we use now Greater Capital City Statistical Areas – is that they include vast amounts of rural land and national parks. In fact, in 2016, at least 53% of Greater Sydney’s land area had zero population. That statistic is 24% in Melbourne and 14% in Adelaide – so there is also no consistency between cities.
Below is a map of Greater Sydney (sourced from ABS), with the blue boundary representing Greater Sydney:
One solution to this issue is to try to draw a tighter boundary around the urban area, and in this post I’ll also use Significant Urban Areas (SUAs) that do a slightly better job (they are made up of SA2s). The red boundaries on the above map show SUAs in the Sydney region.
However SUAs they still include large parks, reserves, industrial areas, airports, and large-area partially-populated SA2s on the urban fringe. Urban centres are slightly better (they are made of SA1s) but population data for these is only available in census years, the boundaries change with each census, the drawing of boundaries hasn’t been consistent over time, they include non-residential land, and they split off most satellite urban areas that are arguably still part of cities, even if not part of the main contiguous urban area.
Enter population-weighted density (PWD) which I’ve looked at previously (see Comparing the densities of Australian, European, Canadian, and New Zealand cities). Population-weighted density takes a weighted average of the density of all parcels of land that make up a city, with each parcel weighted by its population. One way to think about it is the average density of the population, rather than the average density of the land.
So parcels of land with no population don’t count at all, and large rural parcels of land that might be inside the “metropolitan area” count very little in the weighted average because of their relatively small population.
This means population-weighted density goes a long way to overcoming having to worry about the boundaries of the “urban area” of a city. Indeed, previously I have found that removing low density parcels of land had very little impact on calculations of PWD for Australian cities (see: Comparing the residential densities of Australian cities (2011)). More on this towards the end of this post.
Calculations of population-weighted density can also answer the question about whether the “average density” of a city has been increasing or decreasing.
But… measurement geography matters
One of the pitfalls of measuring population weighted density is that it very much depends on the statistical geography you are using.
If you use larger geographic zones you’ll get a lower value as most zones will include both populated and unpopulated areas.
If you use very small statistical geography (eg mesh blocks) you’ll end up with a lot fewer zones that are partially populated – most will be well populated or completely unpopulated, and that means your populated weighted density value will be much higher, and your measure is more looking at the density of housing areas.
To illustrate this, here’s an animated map of the Australian Capital Territory’s 2016 population density at all of the census geographies from mesh block (MB) to SA3:
Only at the mesh block and SA1 geographies can you clearly see that several newer outer suburbs of Canberra have much higher residential densities. The density calculation otherwise gets washed out quickly with lower resolution statistical geography, to the point where SA3 geography is pretty much useless as so much non-urban land is included (also, there are only 7 SA3s in total). I’ll come back to this issue at the end of the post.
Even if you have a preferred statistical geography for calculations, making international comparisons is very difficult because few countries will following the same guidelines for creating statistical geography. Near enough is not good enough. Worse still, statistical geography guidelines do not always result in consistently sized areas within a country (more on that later).
We need an unbiased universal statistical geography
This ABS is now providing population estimates on a square km grid for every year from 2006.
Here is what Melbourne’s estimated population density looks like on a km square grid, animated from 2006 to 2017:
The changes over time are relatively subtle, but if you watch the animation several times you’ll see growth – including relatively high density areas emerging on the urban fringe.
It’s a bit chunky, and it’s a bit of a matter of luck as to whether dense urban pockets fall entirely within a single grid square or on a boundary, but there is no intrinsic bias.
There’s also an issue that many grid squares will contain a mix of populated and non-populated land, particularly on the urban fringe (and a similar issue on coastlines). In a large city these will be in the minority, but in smaller cities these squares could make up a larger share of the total, so I think we need to be careful about this measure in smaller cities. I’m going to arbitrarily draw the line at 200,000 residents.
How are Australian cities trending for density using square km grid data 2006 to 2018?
So now that we have an unbiased geography, we can measure PWD for cities over time.
The following chart is based on 2016 Significant Urban Area boundaries (slightly smaller than Greater Capital City Statistical Areas but also they go across state borders as appropriate for Canberra – Queanbeyan and Gold Coast – Tweed).
Technical notes: You cannot perfectly map km squares to Significant Urban Areas. I’ve included all kilometre grid squares which have a centroid within the 2016 Significant Urban Area boundaries (with a 0.01 degree tolerance added – which is roughly 1 km). Hobart appears only in 2018 because the Hobart SUA crosses the 200,000 population threshold in 2018.
The above trend chart was a little congested for the smaller cities, so here is a zoomed in version without Sydney and Melbourne:
You can see most cities getting denser at various speeds, although Perth, Geelong, and Newcastle have each flat-lined for a few years.
Perth’s population growth slowed at the end of the mining boom around 2013, and infill development all but dried up, so the overall PWD increased only 0.2 persons/ha between 2013 and 2018.
Canberra has seen a surge in recent years, probably due to high density greenfield developments we saw above.
How is the mix of density changing? (2006 to 2018)
Here’s a look at the changing proportion of the population living at different densities for 2006-2018 for the five largest Australian cities, using square km grid geography:
It looks very much like the Melbourne breakdown bleeds into the Sydney breakdown. This roughly implies that Melbourne’s density distribution is on trend to look like Sydney’s 2006 distribution in around 2022 (accounting the for white space). That is, Melbourne’s density distribution is around 16 years behind Sydney’s on recent trends. Similarly, Brisbane looks a bit more than 15 years behind Melbourne on higher densities.
In Perth up until 2013 there was a big jump in the proportion of the population living at 35 persons / ha or higher, but then things peaked and the population living at higher densities declined, particularly as there was a net migration away from the inner and middle suburbs towards the outer suburbs.
Here’s the same for the next seven largest cities:
Of the smaller cities, densities higher than 35 persons/ha are only seen in Gold Coast, Newcastle, Wollongong and more recently in Canberra.
The large number of people living at low densities in the Sunshine Coast might reflect suburbs that contain a large number of holiday homes with no usual residents (I suspect the dwelling density would be relatively higher). This might also apply in the Gold Coast, Central Coast, Geelong (which actually includes much of the Bellarine Peninsula) and possibly other cities.
Also, the Central Coast and Sunshine Coast urban patterns are highly fragmented which means lots of part-urban grid squares, which will dilute the PWD of these “cities”.
Because I am sure many of you will be interested, here are animated maps for these cities:
Sydney
Brisbane
Perth
Adelaide
Canberra – Queanbeyan
Sunshine Coast
Gold Coast
Newcastle – Maitland and Central Coast
Wollongong
Geelong
What are the density trends further back in time using census data?
The census provides the highest resolution and therefore the closest measure of “residential” population weighted density. However, we’ve got some challenges around the statistical geography.
Prior to 2006, the smallest geography at which census population data is available is the collector district (CD), which average around 500 to 600 residents. A smaller geography – the mesh block (MB) – was introduced in 2006 and averages around 90 residents.
Unfortunately, both collector districts and mesh blocks are not consistently sized across cities or years (note: y axis on these charts does not start at zero):
Technical note: I have mapped all CDs and MBs to Greater Capital City Statistical Area (GCCSA) boundaries, based on the entire CD fitting within the GCCSA boundaries (which have not yet changed since they were created in 2011).
There is certainly some variance between cities and years, so we need to proceed with caution, particularly in comparing cities. Hobart and Adelaide have the smallest CDs and MBs on average, while Sydney generally has larger CDs and MBs. This might be a product of whether mesh blocks were made too small or large, or it might be that density is just higher and it is more difficult to draw smaller mesh blocks. The difference in median population may or may not be explained by the creation of part-residential mesh blocks.
Also, we don’t have a long time series of data at the one geography level. Rather than provide two charts which break at 2006, I’ve calculated PWD for both CD and mesh block geography for 2006, and then estimated equivalent mesh block level PWD for earlier years by scaling them up by the ratio of 2006 PWD calculations.
In Adelaide, the mesh block PWD for 2006 is 50% larger than the CD PWD, while in the Australian Capital Territory it is 110% larger, with other cities falling somewhere in between.
Would these ratios hold for previous years? We cannot be sure. Collector Districts were effectively replaced with SA1s (with an average population of 500, only slightly smaller) and we can calculate the ratio of mesh block PWD to SA1 PWD for 2011 and 2016. For most cities the ratio in 2016 is within 10% of the ratio in 2011. So hopefully the ratio of CD PWD to mesh block PWD would remain fairly similar over time.
So, with those assumptions, here’s what the time series then looks like for PWD at mesh block geography:
As per the square km grid values, Sydney and Melbourne are well clear of the pack.
Most cities had a PWD low point in 1996. That is, until around 1996 they were sprawling at low densities more than they were densifying in established areas, and then the balance changed post 1996. Exceptions are Darwin which bottomed out in 2001 and Hobart which bottomed in 2006.
The data shows rapid densification in Melbourne and Sydney between 2011 and 2016, much more so than the square km grid data time series. But we also saw a significant jump in the median size of mesh blocks in those cities between 2011 and 2016 (and if you dig deeper, the distribution of mesh block population sizes also shifted significantly), so the inflection in the curves in 2011 are at least partly a product of how new mesh block boundaries were cut in 2016, compared to 2011. Clearly statistical geography isn’t always good for time series and inter-city analysis!
How has the distribution of densities changed in cities since 1986?
The next chart shows the distribution of population density for Greater Capital City Statistical Areas based on collector districts for the 1986 to 2006 censuses:
You can more clearly see the decline in population density in most cities from 1986 to 1996, and it wasn’t just because most of the population growth was a lower densities. In Hobart, Canberra, Adelaide, Brisbane and Melbourne, the total number of people living at densities of 30 or higher actually reduced between 1986 and 1996.
Here is the equivalent chart for change in density distribution by mesh block geography for the capital cities for 2006, 2011, and 2016:
I’ve used the same colour scale, but note that the much smaller geography size means you see a lot more of the population at the higher density ranges.
The patterns are very similar to the distribution for square km grid data. You can see the how Brisbane seems to bleed into Melbourne and then into Sydney, suggesting a roughly 15 year lag in density distributions. This chart also more clearly shows the recent rapid rise of high density living in the smaller cities of Canberra and Darwin.
The next chart shows the 2016 distribution of population by mesh block density using Statistical Urban Area 2016 boundaries, including the smaller cities:
Gold Coast and Wollongong stand out as smaller cities with a significant portion of their population at relatively high densities, but a fair way off Sydney and Melbourne.
(Sorry I don’t have a mesh block times series of density distribution for the smaller cities – it would take a lot of GIS processing to map 2006 and 2011 mesh blocks to 2016 SUAs, and the trends would probably be similar to the km grid results).
Can we measure density changes further back in history and for smaller cities?
Yes, but we need to use different statistical geography. Annual population estimates are available at SA2 geography back to 1991, and at SA3 geography back to 1981.
However, there are again problems with consistency in statistical geography between cities and over time.
Previously on this blog I had assumed that guidelines for creation of statistical geography boundaries have been consistently applied by the ABS across Australia, resulting in reasonably consistent population sizes, and allowing comparisons of population-weighted density between cities using particular levels of statistical geography.
Unfortunately that wasn’t a good assumption.
Here are the median population sizes of all populated zones for the different statistical geographies in the 2016 census:
Note: I’ve used a log scale on the Y-axis.
While there isn’t a huge amount of variation between medians at mesh block and SA1 geographies, there are massive variations at SA2 and larger geographies.
SA2s are intended to have 3,000 to 25,000 residents (a fairly large range), with an average population of 10,000 (although often smaller in rural areas). You can see from the chart above that there are large variances between medians of the cities, with the median size in Canberra and Darwin below the bottom of the desired range.
I have asked the ABS about this issue. They say it is related to the size of gazetted localities, state government involvement, some dense functional areas with no obvious internal divisions (such as the Melbourne CBD), and the importance of capturing indigenous regions in some places (eg the Northern Territory). SA2 geography will be up for review when they update statistical geography for 2021.
While smaller SA2s mean you get higher resolution inter-censal statistics (which is nice), it also means you cannot compare raw population weighted density calculations between cities at SA2 geography.
However, all is not lost. We’ve got calculations of PWD on the unbiased square kilometre grid geography, and we can compare these with calculations on SA2 geography. It turns out they are very strongly linearly correlated (r-squared of over 0.99 for all cities except Geelong).
So it is possible to estimate square km grid PWD prior to 2006 using a simple linear regression on the calculations for 2006 to 2018.
But there is another complication – ABS changed the SA2 boundaries in 2016 (as is appropriate as cities grow and change). Data is available at the new 2016 boundaries back to 2001, but for 1991 to 2000 data is only available on the older 2011 boundaries. For most cities this only creates a small perturbation in PWD calculations around 2001 (as you’ll see on the next chart), but it’s larger for Geelong, Gold Coast – Tweed Heads and Newcastle Maitland so I’m not willing to provide pre-2001 estimates for those cities.
The bottom of this chart is quite congested so here’s an enlargement:
Even if the scaling isn’t perfect for all history, the chart still shows the shape of the curve of the values.
Consistent with the CD data, several cities appear to have bottomed out in the mid 1990s. On SA2 data, that includes Adelaide in 1995, Perth and Brisbane in 1994, Canberra in 1998 and Wollongong in 2006.
Can we go back further?
If we want to go back another ten years, we need to use SA3 geography, which also means we need to switch to Greater Capital City Statistical Areas as SA3s don’t map perfectly to Significant Urban Areas (which are constructed of SA2s). Because they are quite large, I’m only going to estimate PWD for larger cities which have reasonable numbers of SA3s that would likely have been fully populated in 1981.
I’ve applied the same linear regression approach to calculate estimated square kilometre grid population weighted density based on PWD calculated at SA3 geography (the correlations are strong with r-squared above 0.98 for all cities).
The following chart shows the best available estimates for PWD back to 1981, using SA3 data for 1991 to 2000, SA2 data for 2001 to 2005, and square km grid data from 2006 onwards:
Technical notes: SA3 boundaries have yet to change within capital cities, so there isn’t the issue we had with SA2s. The estimates based on SA2 and SA3 data don’t quite line up between 1990 and 1991 which demonstrates the limitations of this approach.
The four large cities shown appear to have been getting less dense in the 1980s (Melbourne quite dramatically). These trends could be related to changes in housing/planning policy over time but they might also be artefacts of using such a coarse statistical geography. It tends to support the theory that PWD bottomed out in the mid 1990s in Australia’s largest cities.
Could we do better than this for long term history? Well, you could probably do a reasonable job of apportioning census collector district data from 1986 to 2001 censuses onto the km grid, but that would be a lot of work! It also wouldn’t be perfectly consistent because ABS use dwelling address data to apportion SA1 population estimates into kilometre grid cells. Besides we have reasonable estimates using collector district geography back to 1986 anyway.
Melbourne’s population-weighted density over time
So many calculations of PWD are possible – but do they have similar trends?
I’ve taken a more detailed look at my home city Melbourne, using all available ABS population figures for the geographic units ranging from mesh blocks to SA3s inside “Greater Melbourne” and/or the Melbourne Significant Urban Area (based on the 2016 boundary), to produce the following chart:
Most of the datasets show an acceleration in PWD post 2011, except the SA3 calculations which are perhaps a little more washed out. The kink in the mesh block PWD is much starker than the other measures.
The Melbourne SUA includes only 62% of the land of the Greater Melbourne GCCSA, yet there isn’t much difference in the PWD calculated at SA2 geography – which is the great thing about population-weighted density.
All of the time series data suggests 1994 was the year in which Melbourne’s population weighted density bottomed out.
Appendix 1: How much do PWD calculations vary by statistical geography?
Census data allows us to calculate PWD at all levels of statistical geography to see if and how it distorts with larger statistical geography. I’ve also added km grid PWD calculations, and here are all the calculations for 2016:
Technical note: square km grid population data is estimated for 30 June 2016 while the census data is for 9 August 2016. Probably not a significant issue!
You can see cities rank differently when km grid results are compared to other statistical geography – reflecting the biases in population sizes at SA2 and larger geographies. Wollongong and Geelong also show a lot of variation in rank between geographies – probably owing to their small size.
The cities with small pockets of high density – in particular Gold Coast – drop rank with large geography as these small dense areas quickly get washed out.
I’ve taken the statistical geography all the way to Significant Urban Area – a single zone for each city which is the same as unweighted population density. These are absurdly low figures and in no way representative of urban density. They also suggest Canberra is more dense than Melbourne.
Appendix 2: Issues with over-sized SA1s
As I’ve mentioned recently, there’s an issue that the ABS did not create enough reasonably sized SA1s in some city’s urban growth areas in 2011 and 2016. Thankfully, it looks like they did however create a sensible number of mesh blocks in these areas, as the following map (created with ABS Maps) of the Altona Meadows / Point Cook east area of Melbourne shows:
In the north parts of this map you can see there are roughly 4-8 mesh blocks per SA1, but there is an oversized SA1 in the south of the map with around 50 mesh blocks. This will impact PWD calculated at SA1 geography, although these anomalies are relatively small when you are looking at a city as large as Melbourne.
Australian cities are growing in population as a result of international migration, internal migration, and births outnumbering deaths. But which of these factors are most at play in different parts of the country?
Thanks to ABS publishing data on the components of population growth with their Regional Population Growth product, we now have estimates of births, deaths, internal/international arrivals, and internal/international departures right down to SA2 geography for 2016-17 and 2017-18.
This post aims to summarise the main explanation for population change in different parts of the country.
This post isn’t much about transport, but I hope you also find the data interesting. That said, it’s possible that immigrants from transit-orientated countries might be more inclined to use public transport in Australia, and that might impact transport demand patterns. We know that recent immigrants are more likely to travel to work by public transport than longer term residents, but that probably also has a lot to do with where they are settling.
How is population changing in bigger and smaller cities?
First up, I’ve divided Australia into Capital Cities (Greater Capital City Statistical Areas), Large regional cities (Significant Urban Areas with population 100,000+, 2016 boundaries), small regional cities (Significant Urban Areas, with population 10,000 to 100,000, 2016 boundaries ) and “elsewhere”.
Here’s a chart showing the total of the six components of population change in each of those four place types. I’ve animated the chart (and most upcoming charts) to show changes in the years to June 2017 and June 2018, with a longer pause on 2018.
There were significant internal movements in all parts of Australia (shown in green) – even more so in 2018. These include people moving between any SA2s, whether they adjacent within a city or across the country.
International arrivals and departures were much larger in capital cities and there were more arrivals than departures in all four place types. International arrivals declined between 2017 and 2018, while international departures increased slightly between 2017 and 2018.
Births also outnumbered deaths in all place categories in both years.
Here’s a look at the larger capital cities individually:
The chart shows Sydney, Perth, and Adelaide had more internal departures than arrivals. These cities only grew in total population because of natural increase and net international immigration. Melbourne and Brisbane had a net increase from internal movements in both 2017 and 2018, while Canberra has been a lot more even.
International arrivals outnumbered international departures and births significantly outnumbered deaths in all cities. Melbourne and Canberra were the only cities to see a significant increase in international arrivals between 2017 and 2018.
Here is the same chart but for medium sized cities:
Again, there were much larger volumes of internal migration in 2017-18 compared to 2016-17.
The Gold Coast is the only medium-sized city to have significant volumes of international movements. The fast population growth of the Gold and Sunshine Coasts is mostly coming from internal arrivals.
What is the dominant explanation for population change in different parts of Australia?
As mentioned the ABS data goes down to SA2 statistical geography which allows particularly fine grain analysis, with six measures available for each SA2. However it is difficult to show those six components spatially. They can be consolidated into three categories: net natural increase, net internal arrivals/departures, and net international arrivals/departures, but that is still three different metrics for all SA2s.
One way to look at this is simply the component with the largest contribution to population growth (or decline). Here is a map showing that for each SA2 in Melbourne:
You can see that international arrivals dominated population growth in most inner and middle suburbs, while internal arrivals dominated population growth in most outer suburbs. There are also some SA2s where births dominated (often low growth outer suburbs).
This representation is quite simplified, and doesn’t show what else might be happening. For example, here is a summary of the population changes in Sunshine for the year to June 2018:
Population change in Sunshine, year to June 2018
Overseas arrivals dominated population growth (net +313), but the otherwise hidden story here is that they were largely offset by net internal departures of 279.
So to add more detail to the analysis, I’ve created a slightly more detailed classification system that looks at the largest component and often a secondary component, as per the following table.
Explanation summary
Largest component
Other components
Growth – mostly births replacing locals
Natural increase
Net internal departures more than 50 and net internal departures more than net overseas departures
Growth – mostly births
Natural increase
Net internal and overseas departures of no more than 50
Growth – mostly immigrants replacing locals
Net overseas arrivals
Net internal departures of at least 50 and/or natural decrease of at least 50.
Growth – mostly immigration
Net overseas arrivals
Net internal departures less than 50 (or net arrivals).
Net natural decrease of 50 or more, and bigger than net overseas departures
Growth – mostly internal arrivals
Net internal arrivals
Net internal arrivals greater than net overseas arrivals and natural increase
Decline – mostly internal departures
Net internal departures
Natural increase and net overseas arrivals both less than 50
Decline – mostly internal departures partly offset by births
Net internal departures
Natural increase of at least 50, and natural increase larger than net overseas arrivals.
Decline – mostly internal departures partly offset by immigrants
Net internal departures
Net overseas arrivals of at least 50, and net overseas arrivals larger than natural increase.
Decline – mostly deaths
Natural decrease
–
There are no SA2s where net international departures was the major explanation for population change.
Here’s what these summary explanations look like in Melbourne (again, animated to show years to June 2017 and June 2018):
Technical notes: On these maps I’ve omitted SA2s where there was population change of less than 50 people, or where no components of population change were more than 1% of the population. Not all classifications are present on all maps.
You can now see that in most middle suburbs there has been a net exodus of locals, more than offset by net international arrivals (light purple). Also, many of the outer suburbs with low growth actually involve births offsetting internal departures (light blue).
Turning near-continuous data into discrete classifications is still slightly problematic. For example the summary explanations don’t tell you by how much one component was larger than the others. For example if there were 561 net international arrivals and 560 net internal arrivals, it would be classified as “Growth – mostly immigration”. Also, SA2s are not consistently sized across Australia (see: How is density changing in Australian cities?), so my threshold of 50 is not perfect. At the end of the post I provide a link to Tableau where you can inspect the data more closely for any part of Australia.
The inner city area of Melbourne was a little congested with data marks on the above map, so here is a map zoomed into inner and middle Melbourne:
You can see significant population growth in the Melbourne CBD and surrounding SA2s, particularly in 2017. The main explanation for inner city growth is international immigration, although internal arrivals came out on top in Southbank in 2018. Curiously, net internal arrivals were larger the international migration in Brunswick East in both years. And natural increase was dominant in Newport in the inner-west.
Zooming out to include the bigger regional centres of Victoria (note: many regional SA2s don’t show up because of very little population change):
In most regional Victorian cities, internal arrivals account for most of the population growth, although the net growth in “Shepparton – North” of +222 in 2017 and +152 in 2018 was mostly made up of international arrivals. The only other SA2s to show international arrivals as the main explanation were in inner Geelong.
(I haven’t shown all of Victoria because few SA2s outside the above map had significant population change).
Heading up to Sydney, the picture is fairly similar to Melbourne:
Like Melbourne, internal arrivals accounted for most of the population growth in outer growth areas.
International immigration dominated the inner and middle suburbs in 2017, but in 2018 immigration eased off, and births became the main explanation for population growth in more SA2s.
The middle SA2s of Homebush Bay – Silverwater and Botany are noticeable exceptions to the pattern, dominated by internal arrivals.
Zooming out to New South Wales:
Central Newcastle, central Wollongong, Armidale and Griffith saw mostly international immigration led population growth. Most larger regional towns saw growth from internal arrivals, but further inland there was population decline – mostly from internal departures.
Next up, Brisbane:
Population growth in Brisbane’s inner suburbs is much more of a mix of internal and overseas arrivals. There are also more SA2s where births dominate population growth. There were also some SA2s with slight population decline for various reasons.
Zooming out to South East Queensland:
International arrivals dominated areas on the Gold Coast closer to the coastline, but much less so on the Sunshine Coast and in Toowoomba.
Looking at other parts of Queensland:
There was population decline in several areas, including Mackay and Mount Isa. Rockhampton and Cairns saw population growth mostly through internal arrivals. Townsville was dominated by internal arrivals in 2017, and births in 2018.
Airlie – Whitsundays stands out as having population growth mostly from international arrivals in both years.
Next up, Perth:
Like other cities, population growth in the outer suburbs was dominated by internal arrivals. There were a lot more SA2s showing population decline, and this was largely due to internal departures, partly offset by natural increases or net overseas arrivals.
Zooming out to Western Australia:
Population growth on the south-west coast was mostly dominated by internal arrivals, while in many other centres around the state there was population decline, mostly due to internal departures, however in many areas this was offset partly by births.
Next up, Adelaide:
Firstly, keep in mind that there has been relatively slow population growth in Adelaide (the scale is adjusted). The inner and middle suburbs mostly show population growth from international arrivals (often offsetting net internal departures), and the outer growth areas were again mostly about internal arrivals.
Zooming out to South Australia:
In 2017 there was considerable population decline in Whyalla and Port Augusta. Murray Bridge is another rare regional centre where population growth was largely driven by almost 400 overseas arrivals each year.
Next is Tasmania:
Note the circle size scale is even smaller. Overseas arrivals dominated population growth in central Hobart and Newman – Mayfield in Launceston (possibly related to university campuses), while internal migration dominated most other areas.
Here is Canberra:
International immigrants dominated population growth around Civic and the inner north. Internal arrivals dominated Kingston and Griffith and most outer growth areas. The outer suburbs saw a mixture of births and internal arrivals as the dominant explanation.
And finally, Darwin, which actually saw net population decline in the year to June 2018:
Palmerston South saw the largest population growth – mostly from internal arrivals. International arrivals were significant around Darwin city in 2017, but were much less significant in 2018. Most of the northern suburbs saw population decline in the year to June 2018.
Didn’t see your area, or want to explore further? You can view this data interactively in Tableau (you might want to filter by state as that will change the scale of circle sizes).
Where were international arrivals most significant?
I’ve calculated the ratio of international arrivals to population for each SA2. The SA2s where international arrivals in the year to June 2018 make up a significant portion of the 2018 population are all near universities and/or CBDs. Namely:
Melbourne CBD and neighbouring Carlton at 20% (Melbourne Uni, RMIT, and others)
Brisbane CBD at 18% and neighbouring Spring Hill at 20% (QUT and others)
Clayton in Melbourne at 18% (Monash Uni)
Sydney – Haymarket – The Rocks at 15% and neighbouring Pyrmont – Ultimo at 17% (near to UTS, Sydney Uni, and various others)
Acton (ACT) at 17% (ANU)
Kingsford (in Sydney) at 16% (UNSW)
St Lucia (Brisbane) at 15% (UQ)
I hope you’ve found this interesting. In a future post I might look at internal migration origin-destination flows, including how people are moving within and between cities.
In almost every city, hordes of people commute towards the city centre in the morning and back away from the city in the evening. This largely radial travel causes plenty of congestion on road and public transport networks.
But only a fraction of commuters in each city actually work in the CBD. So just how radial are journeys to work? How does it vary between cities? And how does it vary by mode of transport?
This post takes a detailed look at journey to work data from the ABS 2016 Census for Melbourne, Sydney, and to a less extent Brisbane, Perth, Adelaide and Canberra. I’ve included some visualisations for Melbourne and Sydney that I hope you will find interesting.
How to measure radialness?
I’m measuring radialness by the difference in degrees between the bearing of the journey to work, and a direct line from the home to the CBD of the city. I’m calling this the “off-radial angle”.
So an off-radial angle of 0° means the journey to work headed directly towards the CBD. However that doesn’t mean the workplace was the CBD, it might be have been short of the CBD or even on the opposite side of the CBD.
Similarly, an off-radial angle of 180° means the journey to work headed directly away from the CBD. And a value of 90° means that the trip was “orbital” relative to the CBD (a Melbourne example would be a journey from Box Hill that headed either north or south). And then there are all the angles in between.
To deal with data on literally millions of journeys to work, I’ve grouped journeys by home and work SA2 (SA2s are roughly the size of a suburb), and my bearing calculations are based on the residential centroid of the home SA2 and the employment centroid of the work SA2.
So it is certainly not precise analysis, but I’ve also grouped off-radial angles into 10 degree intervals, and I’m mostly looking for general trends and patterns.
So how radial are trips in Melbourne and Sydney?
Here’s a chart showing the proportion of 2016 journeys to work at different off-radial angle intervals:
Technical note: As per all my posts, I’ve designated a main mode for journeys to work: any journey involving public transport is classed as “Public”, any journey not involving motorised transport is classed as “Active”, and any other journey is classed as “Private”.
In both cities over 30% of journeys to work were what you might call “very radial” – within 10 degrees of perfectly radial. It was slightly higher in Melbourne.
You can also see that public transport trips are even more radial, particularly in Melbourne. In fact, around two-thirds of public transport journeys to work in 2016 had a destination within 2 km of the CBD.
Melbourne’s “mass transit” system (mostly trains and trams) is very radial, so you might be wondering why public transport accounts for less than half of those very radial journeys (41% in fact).
Here are Melbourne’s “very radial” journeys broken down by workplace distance from the Melbourne CBD:
Public transport dominates very radial journeys to workplaces within 2 km of the centre of the CBD, but is a minority mode for workplaces at all other distances. Many of these highly radial journeys might not line up with a transit line towards the city, and/or there could well be free parking at those suburban workplaces that make driving all too easy. I will explore this more shortly.
Sydney however had higher public transport mode shares for less radial journeys to work. I think this can be explained by Sydney’s large and dense suburban employment clusters that achieve relatively high public transport mode shares (see: Suburban employment clusters and the journey to work in Australian cities), the less radial nature of Sydney’s train network, and generally higher levels of public transport service provision, particularly in inner and middle suburbs.
Visualising radialness on maps
To visualise journeys to work it is necessary to simplify things a little so maps don’t get completely cluttered. On the following maps I show journey to work volumes between SA2s where there are at least 50 journeys for which the mode is known. The lines between home and work SA2s get thicker at the work end, and the thickness is proportional to the volume (although it’s hard to get a scale that works for all scenarios).
First up is an animated map that shows journeys to work coloured by private transport mode share, with each frame showing a different interval of off-radial angle (plus one very cluttered view with all trips):
(click/tap to enlarge maps)
I’ve had to use a lot of transparency so you have a chance at making out overlapping lines, but unfortunately that makes individual lines a little harder to see, particularly for the larger off-radial angles.
You can see a large number of near-radial journeys, and then a smattering of journeys at other off-radial angles, with some large volumes across the middle suburbs at particular angles.
The frame showing very radial trips was rather cluttered, so here is an map showing only those trips, animated to strip out workplaces in the CBD and surrounds so you can see the other journeys:
Private transport mode shares of very radial trips are only very low for trips to the central city. When the central city jobs are stripped out, you see mostly high private transport mode shares. Some relative exceptions to this include journeys to places like Box Hill, Hawthorn, and Footscray. More on that in a future post.
Here are the same maps for Sydney:
Across both of these maps you can find Sydney’s suburban employment clusters which have relatively low private transport mode shares. I explore this, and many other interesting ways to visualise journeys to work on maps in another post.
What about other Australian cities?
To compare several cities on one chart, I need some summary statistics. I’ve settled on two measures that are relatively easy to calculate – namely the average off-radial angle, and the percent of journeys that are very radial (up to 10°).
The ACT (Canberra) actually has the most radial journeys to work of these six cities, despite it being something of a polycentric city. Adelaide has the next most radial journeys to work, but there’s not a lot of difference in the largest four cities, despite Sydney being much more a polycentric city than the others. Note the two metrics do not correlate strongly – summary statistics are always problematic!
Here are those radialness measures again, but broken down by main mode:
Sydney now looks the least radial of the cities on most measures and modes, particularly by public transport.
The Australian Capital Territory (Canberra) has highly radial private and active journeys to work, but much less-radial public transport journeys than most other cities. This probably reflects Canberra’s relatively low cost parking (easy to drive to the inner city), but also that the public transport bus network is orientated around the suburban town centres that contain decent quantities of jobs.
Adelaide has the most radial journeys to work when it comes to active and public transport.
What about other types of travel?
In a future post, I’ll look at the radialness of general travel around Melbourne using household travel survey data (VISTA), and answer some questions I’ve been pondering for a while. Is general travel around cities significantly less radial than journeys to work? Is weekend travel less radial than weekday travel?
Follow the blog on twitter or become an email subscriber (see top-right of this page) to get alerted when that comes out.
The unwritten rules of mapping data include avoiding too much data and clutter, and not using too much colour. This blog often violates those rules, and when it comes to visualising journeys to work, I think we can learn a lot about cities with somewhat cluttered colourful animated maps.
This post maps journeys to work in Melbourne, using data from the 2016 census. I will look at which types of home-work pairs have different public, private and active transport mode shares and volumes.
Although this post will focus on Melbourne, I will include a brief comparison to Sydney at the end.
Where are public transport journeys to work in Melbourne?
First I need to explain the maps you are about to see.
So that I can show mode shares, I’ve grouped journeys between SA2s (which are roughly the size of a suburb). Lines are drawn from the population centroid of the home SA2 (thin end) to the employment centroid of the work SA2 (thicker end). Centroids are calculated as the weighted average location residents/jobs in each SA2 (using mesh block / destination zone data). This generally works okay for urban areas, but be aware that actual trips will be distributed across SA2s, and some SA2s on the urban fringe are quite large.
The thickness of each line at the work end is roughly proportional to the number of journeys by the mode of interest between the home-work pair (refer legends), but it’s difficult to use a scale that is meaningful for smaller volumes. Unfortunately there’s only so much you can do on a 2-D chart.
I’ve not drawn lines where there are fewer than 50 journeys in total (all modes), or where there were no journeys of the mode that is the subject of the map. This threshold of 50 isn’t perfect either as SA2s are not consistently sized within and between cities, so larger SA2s are more likely to generate lines on the map.
To try to help deal with the clutter, I’ve made the lines somewhat transparent, and also animated the map to highlight trips with different mode share intervals. For frames showing all lines, the lines with highest mode share are drawn on top.
So here is an animated map showing public transport journeys to work in Melbourne, by different mode share ranges and overall:
Technical note: I have included journeys to work that are internal to an SA2. Usually these appear as simple circles, but sometimes they appear as small teardrops where the population and employment centroids are sufficiently far apart.
You can see that the highest PT shares and largest PT volumes are for journeys to the central city, and generally from SA2s connected to Melbourne CBD by train (including many outer suburbs).
As the animation moves to highlight lower PT mode share ranges, the lines become a little less radial, a little shorter on average, and the lowest (non-zero) PT mode shares are mostly for suburban trips.
A notable exception is journeys to Port Melbourne Industrial SA2 (also known as Fishermans Bend), which is located at the junction of two major motorways and is remote from rapid public transport (it does however have a couple of high frequency bus lines from the CBD).
The lowest PT mode shares are seen for trips around the outer suburbs. The maps above unfortunately aren’t very good at differentiating small volumes. The following animated map shows public transport journeys with a filter progressively applied to remove lines with small numbers of public transport journeys (refer blue text in title):
You can see that most of the outer suburban lines quickly disappear as they have very small volumes. Inter-suburban lines with more than 50 public transport journeys go to centres including Dandenong, Clayton, Box Hill, and Heidelberg.
Here’s another animation that builds up the map starting with low public transport mode share lines, and then progressively adds lines with higher public transport mode shares:
As an aside, here is a chart showing journeys to work by straight line distance (between SA2 centroids), public transport mode share, work distance from the CBD and home-work volume:
The black dots represent journeys to the inner 5km of the city, and you can see public transport has a high mode share of longer trips. Public transport mode share falls away for shorter journeys to the inner city as people are more likely to use active transport. A dot on the top left of the curve is 8,874 journeys from Docklands to Melbourne – which benefits from the free tram zone and the distances can be 1-2 km. Most of the longer journeys with low public transport mode share are to workplaces remote from the CBD (coloured dots).
Another way to deal with the clutter of overlapping lines around the CBD is to progressively remove lines to workplaces in and around the CBD. Here is another animated map that does exactly so that you can better see journeys in the nearby inner and middle suburbs.
As you strip away the CBD and inner suburbs, you lose most lines with high public transport mode shares and volumes. However some high public transport mode share lines remain, including the following outbound journeys:
Melbourne (CBD) to Melbourne Airport: 72% of 64 journeys
Melbourne (CBD) to Box Hill: 66% of 76 journeys
Melbourne (CBD) to Clayton: 57% of 82 journeys
South Yarra – East to Clayton: 57% of 173 journeys
Just keep in mind that these are all very small volumes compared to total journeys in Melbourne.
You might have noticed on the western edge of the map some yellow and orange lines from the Wyndham area (south-west Melbourne) that go off the map towards the south west. These journeys go to Geelong.
Here’s a map showing journeys around Geelong and between Geelong and Greater Melbourne (journeys entirely within Greater Melbourne excluded):
You can see very high public transport mode shares for journeys from the Geelong and Bellarine region to the Melbourne CBD and Docklands (and fairly large volumes), but no lines to Southbank, East Melbourne, Parkville or Carlton – all more remote from Southern Cross Station, the city terminus for regional trains.
(The other purple lines to the CBD are from Ballarat, Bacchus Marsh, Daylesford, Woodend, Kyneton, Castlemaine, Kilmore-Broadford and Warragul, with at least 60 journeys each.)
You can also see those orange and yellow lines from the Wyndham area to central Geelong, being mode shares of 20-40%. The Geelong train line provides frequent services between Tarneit, Wyndham Vale, and Geelong, and has proved reasonably popular with commuters to Geelong (frequency was significantly upgraded in June 2015 with the opening of the Regional Rail Link, just 14 months before the census of August 2016).
However, public transport mode shares for travel within Greater Geelong are very small – even for SA2 that are connected by trains. This might reflect Geelong train station being on the edge of its CBD, relatively cheap parking in central Geelong, limited stopping frequency at some stations (many at 40 minute base pattern), and/or limited walk-up population catchments at several of Geelong’s suburban train stations.
Does public transport have significant mode share for cross-suburban journeys to work?
To search for cross-suburban journeys with relatively high public transport mode shares, here is a map that only shows lines with public transport mode shares above 20% between homes and workplaces both more than 5 km from the CBD (yes, those are arbitrary thresholds):
Of these journeys, the highest mode shares are for journeys from the inner northern suburbs to St Kilda and Hawthorn. There’s also a 49% mode share from Footscray to Maribyrnong (connected by frequent trams and buses).
The tear drop to the north of the city is 114 people who used PT from Coburg to Brunswick (connected by two tram routes and one train route).
Most of the other links on this map are fairly well aligned with train, tram, or SmartBus routes, suggesting high quality services are required to attract significant mode shares.
But these trips are a tiny fraction of journeys to work around Melbourne. In fact 3.0% of journeys to work in Melbourne were by public transport to workplaces more than 5 km from the CBD. The same statistic for Sydney is more than double this, at 7.3%.
What about private transport journeys?
Firstly, here’s a map showing private transport mode shares and volumes, building up the map starting with low private mode share lines.
The links with lowest private transport mode shares are very radial as you might expect (pretty much the inverse of the public transport maps). Progressively less radial lines get added to the map before there is a big bang when the final private transport mode share band of 95-100% gets added, with large volumes of outer suburban trips.
For completeness, here’s an animation that highlights each mode share range individually.
There are some other interesting stories in this data. The following map shows private transport mode share of journeys to work, excluding workplaces up to 10 km from the CBD to remove some clutter.
If you look carefully you’ll see that there is a much lower density of trips that cross the Yarra River (which runs just south of Heidelberg and Eltham). There are limited bridge crossings, and this is probably inhibiting people considering such journeys.
The construction of the North East Link motorway will add considerable cross-Yarra road capacity, and I suspect it may induce more private transport journeys to work across the Yarra River (although tolls will be a disincentive).
What about active transport journeys?
Next is a map for active transport journeys, but this time I’ve progressively added a filter for the number of active transport journeys, as most of the lines on the full chart are for very small volumes.
As soon as the filter reaches a minimum of 50 active journeys most of the lines between SA2s in the middle and outer suburbs disappear. Note that journeys between SA2s are not necessarily long, they might just be a short trip over the boundary.
Then at minimum 200 journeys you can only see central city journeys plus intra-SA2 journeys in relatively dense centres such as Hawthorn, Heidelberg, Box Hill, Clayton, Frankston, Mornington, Footscray, and St Kilda. The large volume in the south of the map that hangs around is Hastings – Somers, where 882 used active transport (probably mostly walking to work on the HMAS Cerebus navy base).
Active transport journeys are mostly much shorter than private and public transport journeys – as you might expect as most people will only walk or ride a bicycle so far. But there are people who said they made very long active transport journeys to work – the map shows some journeys from Point Nepean, Torquay, Ballarat, Daylesford, and Castlemaine to Melbourne. That’s some keen cyclists, incredible runners, people who changed jobs in the week of the census (the census asks for work location the prior week, and modes used on census day), and/or people who didn’t fill in their census forms accurately. The volumes of these trips are very small (mostly less than 5).
That map is very congested around the central city, so here is a map zoomed into the inner suburbs and this time animated by building up the map starting with high active transport mode share lines.
The highest active transport mode shares are for travel within Southbank and from Carlton to Parkville, followed by journeys to places like the CBD, Docklands, South Yarra, South Melbourne, Carlton, Fitzroy, Parkville, and Carlton.
Then you see a lot of trips added from the inner northern suburbs, which are connected to the central city by dare-I-say “above average” cycling infrastructure across some relatively flat terrain. In particular, a thick red line on the map is for 471 active transport journeys from Brunswick to Melbourne (CBD) with a mode share of 17%. A second thick red line is Richmond to Melbourne (CBD) being 589 journeys with 16% active mode share.
Another way of summarising mode shares by work and home distance from the CBD
I’ve experimented with another visualisation approach to overcome the clutter issues. The next charts have home distances from the CBD on the Y axis, work distances from the CBD on the X axis, bubble size representing number of journeys, and colour showing mode shares. I’m drawing smaller journey volumes on top, and I’ve used some transparency to help a little with the clutter.
Firstly here is public transport (animated to show each mode share range individually):
The chart is roughly a V-shape with many trips on the left edge and along a diagonal (mostly representing intra-SA2 journeys), then with several vertical stripes being major suburban employment destinations (including Dandenong at 31 km, Clayton at 19 km, and Frankston at 40 km). Trips above the diagonal are roughly inbound, while trips below the diagonal are roughly outbound.
Some observations:
The diagonal line (mostly local journeys) has very low public transport mode shares (sometimes zero).
Higher PT mode shares are only seen on the far left and bottom left hand corner of the chart. Some outliers include Richmond to Box Hill (32%), Clayton to Malvern East (32%), and South Yarra – East to Clayton (57%).
PT mode shares of 80+% are only seen for journeys to the CBD from home SA2s at least 11 km out (with one exception of Melbourne CBD to St Kilda with 80% PT share).
Home-work pairs with zero public transport journeys are scattered around the middle and outer suburbs, most being longer distance journeys (home and work at different distances from the CBD).
Here’s the same chart for private transport:
The lowest private transport shares are seen for journeys to the CBD. The diagonal has many mode shares in the 80-90% range.
And here is active transport:
The highest active transport mode shares are seen in the central city area, followed by the diagonal mostly representing local journeys (with generally higher shares closer to the CBD). Some notable outliers include local trips within Clayton (1,298 active trips / 46% active mode share), Box Hill (914 / 40%), Hastings – Somers (1,762 / 27%), Flinders (240 / 24%), Glen Waverley – West (308 / 21%), and Mentone (226 / 23%).
How does Sydney compare to Melbourne?
Here is a chart with private transport mode share maps for both Melbourne and Sydney, animated in tandem to progressively add higher mode share journeys.
You can see that Sydney has a lot more trips at lower private transport mode shares, and that workplaces outside the city centre start to show up earlier in the animation in Sydney – being the dense transit-orientated suburban employment clusters that are largely unique to Sydney (see: Suburban employment clusters and the journey to work in Australian cities).
If time permits, I may do similar analysis for Sydney and other cities in future posts.
In part 1 of this series, I looked at the radialness of general travel around Melbourne based on the VISTA household travel survey. This part 2 digs deeper into radialness by time of the day and week, and maps radialness and mode share for general travel around Melbourne.
A brief recap on measuring radialness: I’ve been measuring the difference in angle between the bearing of a trip, and a straight line to the CBD from the trip endpoint that is furthest from the CBD (origin or destination). An angle of 0° means the trip is perfectly radial (directly towards or away from the CBD) while 90° means the trip is entirely orbital relative to the CBD. An average angle in the low 40s means that there isn’t really any bias towards radial travel. I’ve been calling this two-way off-radial angle. Refer to part 1 if you need more of a refresher.
How does trip radialness vary by time of week?
The first chart shows the average two-way off-radial angle for trips within Greater Melbourne by time and type of day, for private transport, public transport, and walking.
Technical notes: I’ve had to aggregate weekend data into two hour blocks to avoid issues with small sample sizes. I’m only showing data where there are at least 100 trips for a mode and time (that’s still not a huge sample size so there is some “noise”). Trips times are assigned by the clock hour of the middle of the trip duration. For example, a trip starting at 7:50 am and finishing at 9:30 am has a mid-trip time of 8:40 am and therefore is counted in 8 – 9 am for one hour intervals, and 8 – 10 am for two hour intervals.
You can see:
Public transport trips are much more radial at all times of the week, but most particularly in the early AM peak and in the PM commuter peak. They are least radial in the period 3-4 pm on weekdays (PM school peak), which no doubt reflects school student travel, which is generally less radial.
Private transport trips are more radial before 8 am on weekdays, and in the early morning and late evening on weekends. Curiously private transport trips in the PM peak don’t show up as particularly radial, possibly because there is more of a mix of commuter and other trips at that time.
Walking trips show very little radial bias, except perhaps in the commuter peak times on weekdays.
When I drill down into specific modes, the sample sizes get smaller, so I have used 2 hour intervals on weekdays, and 3 hour intervals on weekends. Also to note is that VISTA assigns a “link mode” to each trip, being the most important mode used in the journey (generally train is highest, followed by tram, bus, vehicle driver, vehicle passenger, bicycle, walking only). I am using this “link mode” in the following charts.
Some observations:
Train trips are the most radial, followed by tram trips (no surprise as these networks are highly radial).
Bicycle trips are generally the third most radial mode, except at school times.
Public bus trips are more radial in the commuter peak periods, and much less radial in the middle of the day on weekdays. The greater radialness in commuter peaks will likely reflect people using buses in non-rail corridors to travel to the city centre (particularly along the Eastern Freeway corridor). Most of Melbourne’s bus routes run across suburbs, rather than towards the city centre, which will likely explain bus-only trips being less radial than train and tram, particularly off-peak.
How does radialness vary by trip purpose and time of week?
The following chart shows the average two-way off-radial angle of trips by trip purpose (at destination) and time of day:
Some observations:
Work related trips are generally the most radial, particularly in the AM peak (as you might expect), but less so on weekdays afternoons.
Weekday education trips are the next most radial (excluding trips to go home in the afternoon and evening), except at school times (school travel being less radially biased than tertiary education travel).
Social trips become much more radial late at night on weekends, probably reflecting inner city destinations.
Recreational trips are the least radial on weekends.
Otherwise most other trip purposes average around 35-40° – which is only slightly weighted towards radial travel.
What is the distribution of off-radial angles by time of day?
So far my analysis has been looking at radialness, without regard to whether trips are towards or away from the CBD. I’ve also used average off-radial angles which hides the underlying distribution of trip radialness.
I’m curious as to whether modes are dominated by inbound or outbound trips at any times of the week (particularly private transport), and the distribution of trips across various off-radial angles.
So to add the inbound/outbound component of radialness, I am going to use a slightly different measure, which I call the “one-way off-radial angle”. For this I am using a scale of 0° to 180°, with 0° being directly towards the CBD, and 180° being directly away from the CBD, and 90° being a perfectly orbital trip with regard to the CBD. For inbound trips, the one-way off-radial angle will be the same as the two-way off-radial angle, but outbound trips will instead fall in the 90° to 180° range.
One-way off-radial angles are still calculated relative to the trip end point (origin or destination) that is furthest from the CBD. I explained this in part 1.
Here is the distribution of one-way off-radial angles by time of day for trips where train was the main mode:
A reminder: only time intervals with a sample of at least 100 trips are shown.
In the morning, trips are very much inbound radial, with around three-quarters being angles of 0°-10°. Likewise in the PM peak, almost three-quarters of train trips are very outbound radial with angles 170°-180°.
As per the second chart in this post, train trips remain very radial throughout the day. But there is slightly more diversity in off-radial angles 3-4 pm on weekdays, when many school students use trains for journeys home from school that are less radially biased. Less radial trips could be a result of using two train lines, using bus in combination with train, or using a short section of the train network that isn’t as radial (eg Eltham to Greensborough, Williamstown to Newport, or a section of the Alamein line).
On weekends it’s interesting to see that there are many more inbound than outbound journeys between 12 pm and 2 pm on weekends. The “flip time” when outbound journeys outnumber inbound journeys is probably around 2 pm. This is consistent with CBD pedestrian counters that show peak activity in the early afternoon.
One problem with the chart above is that volumes of train travel vary considerably across the day. So here’s the same data, but as (estimated) average daily trips:
You can see the intense peak periods on weekdays, and a gradual switch from inbound trips to outbound trips around 1 pm on weekdays. There’s also a mini-peak in the “contra-peak” directions (outbound trips in the AM peak and inbound trips in the PM peak).
The weekend volumes are for two hour intervals so not directly comparable to weekdays (which are calculated for one hour intervals), but you can see higher volumes of inbound trips until around 2 pm, and then outbound trip volumes are higher.
Those results for trains were probably not surprising, but what about private vehicle driver trips?
There is much more diversity in off-radial angles at all times of the day, and a less severe change between inbound and outbound trips across the day.
On both weekday and weekend mornings there is a definite bias towards inbound travel. Afternoons and evenings are biased towards outbound travel, but not nearly as much (it’s much stronger late at night). This is consistent with the higher average two-way off-radial angle seen for private transport in the PM peak compared to the AM peak.
Here is the same data again but in volumes:
This shows the weekday AM peak spread concentrated between 8 and 9 am, while the PM peak is more spread over three hours (beginning with the end of school).
Here are the same two charts for tram trips (the survey sample is smaller, so we can only see results for weekdays):
Again there is a strong bias to inbound trips in the morning and outbound in the afternoon, with slightly more diversity in the PM school peak, and early evening.
Next up public bus (a separate category to school buses, however many school students do travel on public buses):
There is a lot more diversity in off-radial angles (particularly 2-4 pm covering the end of school), but also the same trend of more inbound trips in the morning and outbound trips in the afternoon.
Next up, bicycle:
There’s a fair amount of diversity, across the day, with inbound trips dominating the AM peak and outbound trips in the PM commuter peak (but not as strongly in the PM school peak). Weekend late afternoon trips show a little more diversity than morning and early afternoon trips, but the volumes are relatively small.
Next is walking trips:
There is considerable diversity in off-radial angles across most of the week, although outbound trips have a larger share in the late evening.
Walking volumes on weekdays peak at school times. On weekends walking seems to peak between 10 am and 12 pm and again 4 pm to 6 pm, but not considerably compared to the rest of the day time.
Mapping mode shares and radialness
So far I’ve been looking at radialness for modes by time of day. This section next section looks at radialness and mode shares by origins and destinations within Melbourne.
In recent posts I’ve had fun mapping journeys to work from census data (see: Mapping Melbourne’s journeys to work), so I’ve been keep to explore what’s possible for general travel.
VISTA is only a survey of travel (rather than a census), so if you want to map mode shares of trips around the city, you unfortunately need to lose a lot of geographic resolution to get reasonable sample sizes.
The following map shows private transport mode shares for journeys between SA3s (which are roughly the size of municipalities), where there were at least 80 surveyed trips (yes, that is a small sample size so confidence intervals are wider, but I’m also showing mode shares in 10% ranges). Dots indicate trips within an SA3, and lines indicate trips between SA3s. I’ve animated the map to make try to make it slightly easier to call out the high and low private mode shares.
You can see lower private transport mode shares for radial travel involving the central city (Melbourne City SA3), particularly from inner and middle suburbs (less so from outer suburbs). Radial travel that doesn’t go to the city centre generally has high private transport mode shares.
I also have origin and destination SA1s for surveyed trips. Here is a map showing all SA1-SA1 survey trip combinations by main mode, animated to show intervals of two-way off-radial angles:
It’s certainly not a perfect representation because of the all the overlapping lines (I have used a high degree of transparency). You can generally see more blue lines (public transport) in the highly radial angles, and almost entirely red (private transport) and short green lines (active transport) for larger angle ranges. This is consistent with charts in my last post (see: How radial is general travel in Melbourne? (Part 1)).
You can also see that few trips fall into the 80-90° interval, which is because I’m measuring radialness relative to the trip endpoint furthest from the CBD. An angle of 80-90° requires the origin and destination to be about the same distance from the CBD and for the trip to be relatively short.
So there you go, almost certainly more than you ever wanted or needed to know about the radialness of travel in Melbourne. I suspect many of the patterns would also be found in other cities, although some aspects – such the as the geography of Port Phillip Bay – will be unique to Melbourne.
Again, I want to the thank the Department of Transport for sharing the full VISTA data set with me to enable this analysis.
Paid parking is often used when too many people want to park their car in the same place at the same time. Does it encourage people to cycle or use public transport instead of driving? Does that depend on the type of destination and/or availability of public transport? Are places with paid parking good targets for public transport upgrades?
In this post I’m going to try to answer the above questions. I’ll look at where there is paid parking in Melbourne, how transport mode shares vary for destinations across the city, and then the relationship between the two. I’ll take a deeper look at different destination types (particularly hospitals), explore the link between paid parking and employment density, and conclude with some implications for public transport planners. There’s a bit to get through so get comfortable.
This post uses data from around 158,000 surveyed trips around Greater Melbourne collected as part of a household travel survey (VISTA) between 2012 and 2018, as well as journey to work data from the 2016 ABS census.
Unfortunately the data available doesn’t allow for perfect analysis. The VISTA’s survey sample sizes are not large, I don’t have data about how much was paid for parking, nor whether other parking restrictions might impact mode choice (e.g. time limits), and I suspect some people interpreted survey questions differently. But I think there are still some fairly clear insights from the data.
Where is there paid parking in Melbourne?
I’m not aware of an available comprehensive car park pricing data set for Melbourne. Parkopedia tells you about formal car parks (not on street options) and doesn’t share data sets for free, while the City of Melbourne provides data on the location, fees, and time restrictions of on-street bays (only). So I’ve created my own – using the VISTA household travel survey.
For every surveyed trip involving parking a car, van, or truck, we know whether a parking fee was payable. However the challenge is that VISTA is a survey, so the trip volumes are small for any particular place. For my analysis I’ve used groups of ABS Destination Zones (2016 boundaries) that together have at least 40 parking trips (excluding trips where the purpose was “go home” as residential parking is unlikely to involve a parking fee). I’ve chosen 40 as a compromise between not wanting to have too small a sample, and not wanting to have to aggregate too many destination zones. In some cases a single destination zone has enough parking trips, but in most cases I have had to create groups.
I’ve tried to avoid merging different land uses where possible, and for some parts of Melbourne there are just not enough surveyed parking trips in an area (see appendix at the end of this post for more details). Whether I combine zones or use a single zone, I’m calling these “DZ groups” for short.
For each DZ group I’ve calculated the percentage of vehicle parking trips surveyed that involved someone paying a parking fee. The value will be low if only some circumstances require parking payment (eg all-day parking on weekdays), and higher if most people need to pay at most times of the week for both short and long stays (but curiously never 100%). The sample for each DZ group will be a small random sample of trips from different times of week, survey years, and durations. For DZ groups with paid parking rates above 20%, the margin of error for paid parking percentage is typically up to +/- 13% (at a 90% confidence interval).
Imperfect as the measure is, the following map shows DZ groups with at least 10% paid parking, along with my land use categorisations (where a DZ group has a specialised land use).
There are high percentages of paid parking in the central city, as you’d expect. Paid parking is more isolated in the suburbs – and mostly occurs at university campuses, hospitals, larger activity centres, and of course Melbourne Airport.
The next chart shows the DZ groups with the highest percentages of paid parking (together with the margin of error).
Technical note: the Y-axis shows the SA2 name, rather than the (unique but meaningless) DZ code(s), so you will see multiple DZ groups with the same SA2 name.
At the top of the chart are central city areas, major hospitals, several university campuses, and Melbourne Airport.
the area around Melbourne Zoo (Parkville SA2 – classified as “other”),
some inner city mixed-use areas,
two shopping centres – the inner suburban Victoria Gardens Shopping Centre in Richmond (which includes an IKEA store), and Doncaster (Westfield) – the only large middle suburban centre to show up with significant paid parking (many others now have time restrictions), and
some suburban industrial employment areas (towards the bottom of the chart) – in which I’ve not found commercial car parks.
These are mostly places of high activity density, where land values don’t support the provision of sufficient free parking to meet all demand.
While the data looks quite plausible, the calculated values not perfect, for several reasons:
Some people almost certainly forget that they paid for parking (or misinterpreted the survey question). For example, on the Monash University Clayton campus, 45% of vehicle driver trips (n = 126) said no parking fee was payable, 2% said their employer paid, and 12% said it was paid through a salary arrangement. However there is pretty much no free parking on campus (at least on weekdays), so I suspect many people forgot to mention that they had paid for parking in the form of a year or half-year permit (I’m told that very few staff get free parking permits).
Many people said they parked for free in an employee provided off-street car park. In this instance the employer is actually paying for parking (real estate, infrastructure, maintenance, etc). If this parking is rationed to senior employees only then other employees may be more likely to use non-car modes. But if employer provided is plentiful then car travel would be an attractive option. 22% of surveyed trips involving driving to the Melbourne CBD reported parking in an employer provided car park, about a quarter of those said no parking fee was required (most others said their employer paid for parking).
As already mentioned, the sample sizes are quite small, and different parking events will be at different times of the week, for different durations, and the applicability of parking fees may have changed over the survey period between 2012 and 2018.
The data doesn’t tell us how much was paid for parking. I would expect price to be a significant factor influencing mode choices.
Paid parking is not the only disincentive to travel by private car – there might be time restrictions or availability issues, but unfortunately VISTA does not collect such data (it would be tricky to collect).
How does private transport mode share vary across Melbourne?
The other part of this analysis is around private transport mode shares for destinations. As usual I define private transport as a trip that involved some motorised transport, but not any modes of public transport.
Rich data is available for journeys to work from the ABS census, but I’m also interested in general travel, and for that I have to use the VISTA survey data.
For much of my analysis I am going to exclude walking trips, on the basis that I’m primarily interested in trips where private transport is in competition with cycling and public transport. Yes there will be cases where people choose to walk instead of drive because of parking challenges, but I’m assuming not that many (indeed, around 93% of vehicle driver trips in the VISTA survey are more than 1 km). An alternative might be to exclude trips shorter than a certain distance, but then that presents difficult decisions around an appropriate distance threshold.
Here’s a map of private transport mode share of non-walking trips by SA2 destination:
Technical note: I have set the threshold at 40 trips per SA2, but most SA2s have hundreds of surveyed trips.The grey areas of the map are SA2s with fewer than 40 trips, and/or destination zones with no surveyed trips.
For all but the inner suburbs of Melbourne, private transport is by far the dominant mode for non-walking trips. Public transport and cycling only get a significant combined share in the central and inner city areas.
Where is private transport mode share unusually low? And could paid parking explain that?
The above chart showed a pretty strong pattern where private transport mode share is lower in the central city and very high in the suburbs. But are there places where private mode share in unusually low compared to surround land uses? These might be places where public transport can win a higher mode share because of paid parking, or other reasons.
Here’s a similar mode share map, but showing only DZ groups that have a private mode share below 90%:
If you look carefully you can see DZ groups with lower than 80% mode share, including some university/health campuses.
To better illustrate the impact of distance from the city centre, here’s a chart summarising the average private transport mode share of non-walking trips for selected types of places, by distance from the city centre:
Most destination place types are above 90% private transport mode share, except within the inner 5 km. The lowest mode shares are at tertiary education places, workplaces in the central city, secondary schools and parks/recreation. Up the top of the chart are childcare centres, supermarkets and kinders/preschool. Sorry it is hard to decode all the lines – but the point is that they are mostly right up the top.
The next chart brings together the presence of paid parking, distance from the CBD, destination place type, and private transport mode shares. I’ve greyed out DZ groups with less than 20% paid parking, and you can see they are mostly more than 3 km from the CBD. I’ve coloured and labelled the DZ groups with higher rates of paid parking. Also note I’ve used a log scale on the X-axis to spread out the paid DZ groups (distance from CBD).
Most of the DZ groups follow a general curve from bottom-left to top-right, which might reflect generally declining public transport service levels as you move away from the city centre.
The outliers below the main cloud are places with paid parking where private modes shares are lower than other destinations a similar distance from the CBD. Most of these non-private trips will be by public transport. The biggest outliers are university campuses, including Parkville, Clayton, Caulfield, Burwood, and Hawthorn. Some destinations at the bottom edge of the main cloud include university campuses in Kingsbury and Footscray, and parts of the large activity centres of Box Hill and Frankston.
Arguably the presence of paid parking could be acting as a disincentive to use private transport to these destinations.
Contrast these with other paid parking destinations such as hospitals, many activity centres, and Melbourne Airport. The presence of paid parking doesn’t seem to have dissuaded people from driving to these destinations.
Which raises a critical question: is this because of the nature of travel to these destinations means people choose to drive, or is this because of lower quality public transport to those centres? Something we need to unpack.
How strongly does paid car parking correlate with low private transport mode shares?
Here’s a chart showing DZ groups with their private transport mode share of (non-walking) trips and percent of vehicle parking trips involving payment.
Technical note: A colour has been assigned to each SA2 to help associate labels to data points, although there are only 20 unique colours so they are re-used for multiple SA2s. I have endeavoured to make labels unambiguous. It’s obviously not possible to label all points on the chart.
In the top-left are many trip destinations with mostly free parking and very high private transport mode share, suggesting it is very hard for other modes to compete with free parking (although this says nothing about the level of public transport service provision or cycling infrastructure). In the bottom-right are central city DZ groups with paid parking and low private transport mode share.
There is a significant relationship between the two variables (p-value < 0.0001 on a linear regression as per line shown), and it appears that the relative use of paid parking explains a little over half of the pattern of private transport mode shares (R-squared = 0.61). But there is definitely a wide scattering of data points, suggesting many other factors are at play, which I want to understand.
In particular it’s notable that the data points close to the line in the bottom-right are in the central city, while most of the data points in the top-right are mostly in the suburbs (they are also the same land use types that were an exception in the last chart – Melbourne Airport, hospitals, some university campuses, and activity centres).
As always, it’s interesting to look at the outliers, which I am going to consider by land use category.
Melbourne Airport
The airport destination zone has around 62% paid parking and around 92% private transport mode share for general trips (noting the VISTA survey is only of travel by Melbourne and Geelong residents). The airport estimates 14% of non-transferring passengers use some form of public transport, and that 27% of weekday traffic demand is employee travel.
Some plausible explanations for high private mode share despite paid parking include:
shift workers travelling when public transport is infrequent or unavailable (I understand many airport workers commence at 4 am, before public transport has started for the day),
unreliable work finish times (for example, if planes are delayed),
longer travel distances making public transport journeys slower and requiring transfers for many origins,
travellers with luggage finding public transport less convenient,
highly time-sensitive air travellers who might feel more in control of a private transport trip,
active transport involving long travel distances with poor infrastructure, and
many travel costs being paid by businesses (not users).
It’s worth noting that the staff car park is remote from the terminal buildings, such that shuttle bus services operate – an added inconvenience of private transport. But by the same token, the public transport bus stops are a fairly long walk from terminals 1 and 2.
The destination zone that includes the airport terminals also includes industrial areas on the south side of the airport. If I aggregate only the surveyed trips with a destination around the airport terminals, that yields 69% paid parking, and 93% private mode share. Conversely, the industrial area south of the airport yields 6% paid parking, and 100% private mode share.
Hospitals
Almost all hospitals are above the line – i.e. high private mode share despite high rates of paid parking.
The biggest outliers are the Monash Medical Centre in Clayton, Austin/Mercy Hospitals in Heidelberg, and Sunshine Hospital in St Albans South.
The Heidelberg hospitals are adjacent to Heidelberg train station. The Monash Medical Centre at Clayton is within 10 minutes walk of Clayton train station where trains run every 10 minutes or better for much of the week, and there’s also a SmartBus route out the front. Sunshine Hospital is within 10 minutes walk of Ginifer train station (although off-peak services mostly run every 20 minutes).
It’s not like these hospitals are a long way from reasonably high quality public transport. But they are a fair way out from the CBD, and only have high quality public transport in some directions.
The DZ containing Royal Melbourne Hospital, Royal Women’s Hospital, and Victoria Comprehensive Cancer Centre in Parkville is the exception below the line. It is served by multiple high frequency public transport lines, and serves the inner suburbs of Melbourne (also well served by public transport) which might help explain its ~45% private transport mode share.
The Richmond hospital DZ group is close to the line – but this is actually a blend of the Epworth Hospital and many adjacent mixed land uses so it’s not a great data point to analyse unfortunately.
So what might explain high private transport mode shares? I think there are several plausible explanations:
shift workers find public transport infrequent, less safe, or unavailable at shift change times (similar to the airport),
visitors travel at off-peak times when public transport is less frequent,
longer average travel distances (hospitals serve large population catchments with patients and visitor origins widely dispersed),
specialist staff who work across multiple hospitals on the same day,
patients need travel assistance when being admitted/discharged, and
visitor households are time-poor when a family member is in hospital.
The Parkville hospital data point above the line is the Royal Children’s Hospital. Despite having paid parking and being on two frequent tram routes, there is around 80% private transport mode share. This result is consistent with the hypotheses around time-poor visitor households, patients needing assistance when travelling to/from hospitals, and longer average travel distances (being a specialised hospital).
We can also look at census journey to work data for hospitals (without worrying about small survey sample sizes). Here’s a map showing the relative size, mode split and location of hospitals around Melbourne (with at least 200 journeys reported with a work industry of “Hospital”):
It’s a bit congested in the central city so here is an enlargement:
The only hospitals with a minority private mode share of journeys to work are the Epworth (Richmond), St Vincent’s (Fitzroy), Eye & Ear (East Melbourne), and the Aboriginal Health Service (Fitzroy) (I’m not sure that this is a hospital but it’s the only thing resembling a hospital in the destination zone).
Here’s another chart of hospitals showing the number of journeys to work, private transport mode share, and distance from the Melbourne CBD:
Again, there’s a very strong relationship between distance from the CBD and private transport mode share.
Larger hospitals more than 10 km from the CBD (Austin/Mercy, Box Hill, Monash) seem to have slightly lower private mode shares than other hospitals at a similar distance, which might be related to higher parking prices, different employee parking arrangements, or it might be that they are slightly closer to train stations.
The (relatively small) Royal Talbot Hospital is an outlier on the curve. It is relatively close to the CBD but only served by ten bus trips per weekday (route 609).
To test the public transport quality issue, here’s a chart of journey to work private mode shares by distance from train stations:
While being close to a train station seems to enable lower private transport mode shares, it doesn’t guarantee low private transport mode shares. The hospitals with low private transport mode shares are all in the central city.
So perhaps the issue is as much to do with the public transport service quality of the trip origins. The hospitals in the suburbs largely serve people living in the suburbs which generally have lower public transport service levels, while the inner city hospitals probably more serve inner city residents who generally have higher public transport service levels and lower rates of motor vehicle ownership (see: What does the census tell us about motor vehicle ownership in Australian cities? (2006-2016)).
Indeed, here is a map showing private transport mode share of non-walking trips by origin SA2:
Technical notes: grey areas are SA1s (within SA2s) with no survey trips.
Finally for hospitals, here is private transport mode share of journeys to work (from the census) compared to paid parking % from VISTA (note: sufficient paid parking data is only available for some hospitals, and we don’t know whether staff have to pay for parking):
There doesn’t appear to be a strong relationship here, as many hospitals with high rates of paid parking also have high private transport mode shares.
In summary:
The distance of a hospital from the CBD seems to be the primary influence on mode share.
Specialised hospitals with larger catchments (eg Children’s Hospital) might have higher private transport mode shares.
The quality of public transport to the hospital seems to have a secondary impact on mode shares.
Activity centres
Suburban activity centres such as Frankston, Box Hill, Dandenong, and Springvale have high private mode shares, which might reflect lower public transport service levels than the inner city (particularly for off-rail origins).
Box Hill is the biggest outlier for activity centres in terms of high private mode share despite paid parking. But compared to other destinations that far from the Melbourne CBD, it has a relatively low private transport mode share. It is located on a major train line, and is served by several frequent bus routes.
In general, there are fewer reasons why increased public transport investment might not lead to higher public transport mode share compared to airports and hospitals. Travel distances are generally shorter, many people will be travelling in peak periods and during the day, there are probably few shift workers (certainly few around-the-clock shift workers).
University campuses
The biggest university outliers above the line (higher private mode shares and higher paid parking %) are Deakin University (Burwood) and La Trobe University (Kingsbury). Furthermore, private transport also has a majority mode share for Monash University Clayton, Victoria University Footscray Park, Monash University (Caulfield) and Swinburne University (Hawthorn).
As discussed earlier, I suspect the rates of paid parking may be understated for university campuses because people forget they have purchased long-term parking permits.
The following chart shows the full mode split of trips to the University DZ groups in various SA2s (this time including walking trips):
Of the campuses listed, only Hawthorn and Caulfield are adjacent to a train station. Of the off-rail campuses:
Parkville (Melbourne Uni, 43% public transport) is served by multiple frequent tram routes, plus a high frequency express shuttle bus to North Melbourne train station. In a few years it will also have a train station.
Burwood (Deakin, 19% PT) is on a frequent tram route, but otherwise moderately frequent bus services (its express shuttle bus service to Box Hill train station – route 201 – currently runs every 20 minutes)
Footscray (Park) (Victoria Uni, 14% PT) has bus and tram services to Footscray train station but they operate at frequencies of around 15 minutes in peak periods, and 20 minutes inter-peak.
Kingsbury (La Trobe Uni, 13% PT) has an express shuttle bus service from Reservoir station operating every 10 minutes on weekdays (introduced in 2016).
The success of high frequency express shuttle bus services to Parkville and Clayton may bode well for further public transport frequency upgrades to other campuses.
University campuses are also natural targets for public transport as university students on low incomes are likely to be more sensitive to private motoring and parking costs.
However university campuses also have longer average travel distances which might impact mode shares – more on that shortly.
Central city
Most central city DZ groups are in the bottom-right of the scatter plot, but there are some notable exceptions:
A Southbank DZ around Crown Casino has 65% paid parking and 70% private transport mode share. This was also an exception when I analysed journey to work (see: How is the journey to work changing in Melbourne? (2006-2016)) and might be explained be relatively cheap parking, casino shift workers, and possibly more off-peak travel (eg evenings, weekends).
Similarly, a Southbank DZ group around the Melbourne Convention and Exhibition Centre / South Wharf retail complex has 62% paid parking and around 74% private mode share. Many parts of this area are a long walk from public transport stops, and also there are around 2,200 car parks on site (with $17 early bird parking at the time of writing).
Albert Park – a destination zone centred around the park – has around 54% paid parking and 87% private transport mode share. Most of the VISTA survey trips were recreation or sport related, which may include many trips to the Melbourne Sports and Aquatic Centre. The park is surrounded by tram routes on most sides, but is relatively remote from the (rapid) train network.
Northern Docklands shows up with around 50% paid parking and around 88% private transport mode share, despite being very close to the Melbourne CBD. While this area is served by multiple frequent tram routes, it is a relatively long walk (or even tram ride) from a nearby a train station (from Leven Avenue it is 16 minutes by tram to Southern Cross Station and around 18 minutes to Flagstaff Station, according to Google). The closest train station is actually North Melbourne, but there is currently no direct public transport or pedestrian connection (the E-gate rail site and future Westgate Tunnel road link would need to be crossed).
Inner suburbs
Some places to the bottom-left of the cloud on the chart include inner suburban areas such as South Yarra, Fitzroy, Richmond, Abbotsford, Brunswick, and Collingwood. While paid parking doesn’t seem to be as common, private transport mode shares are relatively low (even when walking trips are excluded). These areas typically have dense mixed-use activity with higher public transport service levels, which might explain the lower private transport mode shares. These areas probably also have a lot of time-restricted (but free) parking.
What is the relationship between paid parking and journey to work mode shares?
For journeys to work we thankfully have rich census data, with no issues of small survey sample sizes.
The following chart combines VISTA data on paid parking, with 2016 census data on journey to work mode shares (note: the margin of error on the paid parking percentage is still up to +/-12%).
The pattern is very similar to that for general travel, and the relationship is of a similar strength (r-squared = 0.59).
There are more DZ groups below the line on the left side of the chart, meaning that the private transport mode share of journeys to work is often lower than for general travel.
Indeed, here is a chart comparing private transport mode share of general travel (VISTA survey excluding walking and trips to go home) with journeys to work (ABS census):
Note the margin of error for private transport mode shares is around +/-10% because of the small VISTA sample sizes.
For most DZ groups of all types, private transport mode shares are lower for journeys to work compared to general travel (ie below the diagonal line). This might reflect public transport being more competitive for commuters than for visitors – all-day parking might be harder to find and/or more expensive. This suggests investment in public transport might want to target journeys to work.
The DZ groups above the line include Flemington Racecourse (census day was almost certainly not a race day so there was probably ample parking for employees, while many VISTA survey trips will be from event days), Deakin Uni (Burwood), and a few others. Some of these DZ groups are dominated by schools, where workers (teachers) drive while students are more likely to cycle or catch public transport.
What about public transport mode shares?
The following chart shows VISTA public transport mode shares (for general travel) against paid parking percentages:
There are similar patterns to the earlier private transport chart, but flipped. The outliers are very similar (eg hospitals and Melbourne Airport in the bottom-right), although the top-left outliers include some destinations in socio-economically disadvantaged areas (eg Braybrook, Broadmeadows, Dandenong).
The DZ group in Blackburn South with no paid parking but 22% public transport mode share contains several schools but otherwise mostly residential areas, and the survey data includes many education related trips.
Are shift workers less likely to use public transport?
Shift workers at hospitals, Melbourne Airport, and the casino might be less likely to use public transport because of the inconvenience of travelling at off-peak shift change times, when service levels may be lower or non-existent.
Here’s a chart showing the mode split of VISTA journeys to work by destination type categories, and also type of working hours:
For hospitals, rostered shifts had a lower public transport mode share, compared to fixed and flexible hours workers, so this seems to support (but not prove) the hypothesis.
Public transport use is actually higher for rostered shift workers at other destination types, but I suspect these are mostly not around-the-clock shifts (eg retail work), and are more likely to be lower paid jobs, where price sensitivity might contribute more to mode choice.
Unfortunately there are not enough VISTA journey to work survey responses for Melbourne Airport to get sensible estimates of mode shares for different work types.
Do longer travel distances result in lower public transport mode shares?
Another earlier hypothesis was that destinations that attract longer distance trips (such as universities, hospitals, and airports) are more likely to result in private transport mode choice, as public transport journeys are more likely to require one or more transfers.
Trip distances to specialised places such as airports, suburban employment areas, universities and hospitals are indeed longer. But the central city also rates here and that has low private transport mode shares.
Digging deeper, here are median travel distances to DZ groups around Melbourne:
The central city has higher median trip distances but low private mode shares, while many suburban destinations (particularly employment/industrial areas, universities, and hospitals) have similar median travel distances but much higher public transport mode shares.
I think a likely explanation for this is that public transport to the central city is generally faster (often involving trains), more frequent, and involves fewer/easier transfers. Central city workers are also more likely to live near radial public transport lines. On the other hand, the trip origins for suburban destinations are more likely to be in the suburbs where public transport service levels are generally lower (compared to trip origins in the inner suburbs).
Cross-suburban public transport travel will often require transfers between lower frequency services, and will generally involve at least one bus leg. Very few Melbourne bus routes are currently separated from traffic, so such trips are unlikely to be as fast as private motoring (unless parking takes a long time to find), but they might be able to compete on marginal cost (if there is more expensive paid parking).
Of course this is not to suggest that cross-suburban public transport cannot be improved. More direct routes, higher frequencies, and separation from traffic can all make public transport more time-competitive.
How does parking pricing relate to employment density?
The following chart compares weighted job density (from census 2016) and paid parking percentages (from VISTA):
Technical notes: Weighted job density is calculated as a weighted average of the job densities of individual destination zones in a DZ group, with the weighting being the number of jobs in each zone (the same principle as population weighted density). I have used a log-scale on the X-axis, and not shown DZ groups with less than 1 job/ha as they are not really interesting
There appears to be a relationship between job density and paid parking – as you would expect. The top right quadrant contains many university campuses, hospitals, and central city areas with high job density and high paid parking percentages.
In the bottom-right are many large job-dense shopping centres that offer “free” parking. Of course in reality the cost of parking is built into the price of goods and services at the centres (here’s a thought: what if people who arrive by non-car modes got a discount?). An earlier chart showed us that employees are less likely to commute by private transport than visitors.
The outliers to the top-left of the chart are actually mostly misleading. An example is Melbourne Airport where the density calculation is based on a destination zone that includes runways, taxiways, a low density business park, and much green space. The jobs are actually very concentrated in parts of that zone (e.g. passenger terminals) so the density is vastly understated (I’ve recommended to the ABS that they create smaller destination zones around airport terminal precincts in future census years).
Inclusion of significant green space and/or adjacent residential areas is also an issue at La Trobe University (Kingsbury data point with just under 50% mode share), RMIT Bundoora campus (Mill Park South), Royal Children’s Hospital (Parkville), Sunshine Hospital (St Albans South), Victoria University (Footscray (Park)), Albert Park (the actual park), and Melbourne Polytechnic Fairfield campus / Thomas Embling Hospital (Yarra – North).
I am at a loss to explain paid parking in Mooroolbark – the only major employer seems to be the private school Billanook College.
Can you summarise the relationship between paid parking and mode shares?
I know I’ve gone down quite a few rabbit holes, so here’s a summary of insights:
Distance from the Melbourne CBD seems to be the strongest single predictor of private transport mode share (as origin or destination). This probably reflects public transport service levels generally being higher in the central city and lower in the suburbs. Destinations further from the central city are likely to have trip origins that are also further from the central city, for which public transport journeys are often slower.
Paid parking seems to be particularly effective at reducing private transport mode shares at university campuses, and the impact is probably greater if there are higher quality public transport alternatives available.
There’s some evidence to suggest paid parking may reduce private transport mode shares at larger activity centres such as Box Hill and Frankston.
Most hospitals have very high private transport mode shares, despite also having paid parking. Hospitals with better public transport access have slightly lower private transport mode shares.
Destinations with around-the-clock shift workers (e.g. hospitals and airports) seem generally likely to have high private transport mode shares, as public transport services at shift change times might be infrequent or unavailable.
Suburban destinations that have longer median travel distances (such as hospitals, airports and industrial areas) mostly have higher private transport mode shares.
Even if there isn’t much paid parking, destinations well served by public transport tend to have lower private transport mode shares (although this could be related to time-restricted free parking).
If you’d like more on factors influencing mode shares, I’ve also explored this more broadly elsewhere on this blog, with employment density (related to parking prices), cycling infrastructure quality, proximity to rapid public transport, and walking catchment density found to be significant factors (see: What explains variations in journey to work mode shares between and within Australian cities?).
Are places with paid parking good targets for public transport investments?
Many of my recent conversations with transport professionals around this topic have suggested an hypothesis that public transport wins mode share in places that have paid parking. While that’s clearly the case in the centre of Melbourne and at many university campuses, this research has found it’s more of a mixed story for other destinations.
While this post hasn’t directly examined the impact of public transport investments on mode shares in specific places, I think it can inform the types of destinations where public transport investments might be more likely to deliver significant mode shifts.
Here’s my assessment of different destination types (most of which have paid parking):
Suburban hospitals may be challenging due to the presence of shift workers, patients needing assistance, visitors from time-poor households, and long average travel distances making public transport more difficult for cross-suburban travel. There’s no doubt many people use public transport to travel to hospitals, but it might not include many travellers who have a private transport option.
Larger activity centres with paid parking show lower private transport mode shares. Trips to these centres involve shorter travel distances that probably don’t require public transport transfers, and don’t suffer the challenges of around-the-clock shift workers, so they are likely to be good targets for public transport investment.
Universities are natural targets for public transport, particularly as many students would find the cost of maintaining, operating and parking a car more challenging, or don’t have access to private transport at all (around 35% of full time university/TAFE students do not have a full or probationary licence according to the VISTA sample). Universities do attract relatively higher public transport mode shares (even in the suburbs) and recent investments in express shuttle services from nearby train stations appear to have been successful at growing public transport patronage.
Melbourne Airport has high rates of paid parking and private transport mode share. It is probably a challenging public transport destination for employees who work rostered shifts. However already public transport does well for travel from the CBD, and this will soon be upgraded to heavy rail. Stations along the way may attract new employees in these areas, but span of operating hours may be an issue.
Job dense central city areas that are not currently well connected to the rapid public transport network could be public transport growth opportunity. In a previous post I found the largest journey to work mode shifts to public transport between 2011 and 2016 were in SA2s around the CBD (see: How is the journey to work changing in Melbourne? (2006-2016)). The most obvious target to me is northern Docklands which is not (yet) conveniently connected its nearby train station. Public transport is also gaining patronage in the densifying Fishermans Bend employment area (buses now operate as often as every 8 minutes in peak periods following an upgrade in October 2018).
Lower density suburban employment/industrial areas tend to have free parking, longer travel distances, and very high private transport mode shares. These are very challenging places for public transport to win significant mode share, although there will be some demand from people with limited transport options.
An emerging target for public transport might be large shopping centres that are starting to introduce paid or time-restricted car parking (particularly those located adjacent to train stations, e.g. Southland). That said, Westfield Doncaster, which has some paid parking (around 19%), has achieved only 6% public transport mode share in the VISTA survey (n=365), athough this may be growing over time. Meanwhile, Dandenong Plaza has around 16% public transport mode share despite only 6% paid parking.
Upgraded public transport to shopping centres might be particularly attractive for workers who are generally on lower incomes (we’ve already seen staff having lower private transport mode shares than visitors). Also, customer parking may be time-consuming to find on busy shopping days, which might make public transport a more attractive option, particularly if buses are not delayed by congested car park traffic.
There’s a lot going on in this space, so if you have further observations or suggestions please comment below.
Appendix: About destination group zones
Here is a map showing my destination zone groups in the central city area which have 15% or higher paid parking. Each group is given a different colour (although there are only 20 unique colours used so there is some reuse). The numbers indicate the number of surveyed parking trips in each group:
Some of the DZ groups have slightly less than 40 parking trips, which means they are excluded from much of my analysis. In many cases I’ve decided that merging these with neighbouring zones would be mixing disparate land uses, or would significantly dilute paid parking rates to not be meaningful (examples include northern Abbotsford, and parts of Kew and Fairfield). Unfortunately that’s the limitation of the using survey data, but there are still plenty of qualifying DZ groups to inform the analysis.
I have created destination zone groups for most destination zones with 10%+ paid parking, and most of the inner city area to facilitate the DZ group private transport mode share chart. I haven’t gone to the effort of creating DZ groups across the entire of Melbourne, as most areas have little paid parking and are not a focus for my analysis.
Each year, just in time for Christmas, the good folks at the Australian Bureau of Infrastructure, Transport, and Regional Economics (BITRE) publish a mountain of data in their Yearbook. This post aims to turn those numbers (and some other data sources) into useful knowledge – with a focus on vehicle kilometres travelled, passenger kilometres travelled, mode shares, car ownership, driver’s licence ownership, greenhouse gas emissions, and transport costs.
There are some interesting new patterns emerging – read on.
Vehicle kilometres travelled
According to the latest data, road transport volumes actually fell in 2018-19:
Here’s the growth by vehicle type since 1971:
Light commercial vehicle kilometres have grown the fastest, curiously followed by buses (although much of that growth was in the 1980s).
Car kilometre growth has slowed significantly since 2004, and actually went down in 2018-19 according to BITRE estimates (enough to result in a reduction in total vehicle kilometres travelled).
On a per capita basis car use peaked in 2004, with a general decline since then. Here’s the Australian trend (in grey) as well as city level estimates to 2015 (from BITRE Information Sheet 74):
Technical note: “Australia” lines in these charts represent data points for the entire country (including areas outside capital cities).
Darwin has the lowest average which might reflect the small size of the city. The blip in 1975 is related to a significant population exodus after Cyclone Tracey caused significant destruction in late 1974 (the vehicle km estimate might be on the high side).
Canberra, the most car dependent capital city, has had the highest average car kilometres per person (but it might also reflect kilometres driven by people from across the NSW border in Queanbeyan).
The Australia-wide average is higher than most cities, with areas outside capital cities probably involving longer average car journeys and certainly a higher car mode share.
Passenger kilometres travelled
Overall, here are passenger kms per capital for various modes for Australia as a whole (note the log-scale on the Y axis):
Air travel took off (pardon the pun) in the late 1980s (with a lull in 1990), car travel peaked in 2004, bus travel peaked in 1990 and has been relatively flat since, while rail has been increasing in recent years.
It’s possible to look at car passenger kilometres per capita, which takes into account car occupancy – and also includes more recent estimates up until 2018/19.
Here’s a chart showing total car passenger kms in each city:
The data shows that Melbourne has now overtaken Sydney as having the most car travel in total.
Another interesting observation is that total car travel declined in Perth, Adelaide, and Sydney in 2018-19. The Sydney result may reflect a mode shift to public transport (more on that shortly), while Perth might be impacted by economic downturn.
While car passenger kilometres per capita peaked in 2004, there were some increases until 2018 in some cities, but most cities declined in 2019. Darwin is looking like an outlier with an increase between 2015 and 2018.
BITRE also produce estimates of passenger kilometres for other modes (data available up to 2017-18 at the time of writing).
Back to cities, here is growth in rail passenger kms since 2010:
Sydney trains have seen rapid growth in the last few years, probably reflecting significant service level upgrades to provide more stations with “turn up and go” frequencies at more times of the week.
Adelaide’s rail patronage dipped in 2012, but then rebounded following completion of the first round of electrification in 2014.
Here’s a longer-term series looking at per-capita train use:
Sydney has the highest train use of all cities. You can see two big jumps in Perth following the opening of the Joondalup line in 1992 and the Mandurah line in 2007. Melbourne, Brisbane and Perth have shown declines over recent years.
Here is recent growth in (public and private) bus use:
Darwin saw a massive increase in bus use in 2014 thanks to a new nearby LNG project running staff services.
In more recent years Sydney, Canberra, and Hobart are showing rapid growth in bus patronage.
Here’s bus passenger kms per capita:
Investments in increased bus services in Melbourne and Brisbane between around 2005 and 2012 led to significant patronage growth.
Bus passenger kms per capita have been declining in most cities in recent years.
Australia-wide bus usage is surprisingly high. While public transport bus service levels and patronage would certainly be on average low outside capital cities, buses do play a large role in carrying children to school – particularly over longer distances in rural areas. The peak for bus usage in 1990 may be related to deregulation of domestic aviation, which reduced air fares by around 20%.
Melbourne has the lowest bus use of all the cities, but this likely reflects the extensive train and tram networks carrying the bulk of the public transport passenger task. Melbourne is different to every other Australian city in that trams provide most of the on-road public transport access to the CBD (with buses performing most of this function in other cities).
For completeness, here’s growth in light rail patronage:
Sydney light rail patronage increased following the Dulwich Hill extension that opened in 2014, while Adelaide patronage increased following an extension to the Adelaide Entertainment Centre in 2010.
We can sum all of the mass transit modes (I use the term “mass transit” to account for both public and private bus services):
Sydney is leading the country in mass transport use per capita and is growing strongly, while Melbourne, Brisbane, Perth have declined in recent years.
Mass transit mode share
We can also calculate mass transit mode share of motorised passenger kilometres (walking and cycling kilometres are unfortunately not estimated by BITRE):
Sydney has maintained the highest mass transit mode share, and in recent years has grown rapidly with a 3% mode shift in the three years 2016 to 2019, mostly attributable to trains. The Sydney north west Metro line opened in May 2019, so would only have a small impact on these figures.
Melbourne made significant gains between 2005 and 2009, and Perth also grew strongly 2007 to 2013.
Here’s how car and mass transit passenger kilometres have grown since car used peaked in 2004:
Mass transit use has grown much faster than car use in Australia’s three largest cities. In Sydney and Melbourne it has exceeded population growth, while in Brisbane it is more recently tracking with population growth.
Mass transit has also outpaced car use in Perth, Adelaide, and Hobart:
In Canberra, both car and mass transit use has grown much slower than population, and it is the only city where car growth has exceeded public transport growth.
Car ownership
The ABS regularly conduct a Motor Vehicle Census, and the following chart includes data up until January 2019.
Technical note: Motor Vehicle Census data (currently conducted in January each year, but previously conducted in March or October) has been interpolated to produce June estimates for each year, with the latest estimate being for June 2018.
In 2017-18 car ownership declined slightly in New South Wales, Victoria, and Western Australia, but there was a significant increase in the Northern Territory. Tasmania has just overtaken South Australia as the state with the highest car ownership at 63.1 cars per 100 residents.
Thanks to BITRE Information Sheet 84, the BITRE Yearbook 2019, and some useful state government websites (NSW, SA, Qld), here is motor vehicle licence ownership per 100 persons (of any age) from June 1971 to June 2018 or 2019 (depending on data availability):
Technical note: the ownership rate is calculated as the sum of car, motorbike and truck licenses – including learner and probationary licences, divided by population. Some people have more than one driver’s licence so it’s likely to be an over-estimate of the proportion of the population with any licence.
There’s been slowing growth over time, but Victoria has seen slow decline since 2011, and the ACT peaked in 2014.
Here’s a breakdown by age bands for Australia as a whole (note each chart has a different Y-axis scale):
There was a notable uptick in licence ownership for 16-19 year-olds in 2018. Otherwise licencing rates have increased for those over 40, and declined for those aged 20-39.
Licencing rates for teenagers (refer next chart) had been trending down in South Australia and Victoria until 2017, but all states saw an increase in 2018 (particularly Western Australia). The most recent 2019 data from NSW and Queensland shows a decline. The differences between states partly reflects different minimum ages for licensing.
The trends are mixed for 20-24 year-olds: the largest states of Victoria and New South Wales have seen continuing declines in licence ownership, but all other states and territories are up (except Queensland in 2019).
New South Wales, Victoria, and – more recently – Queensland are seeing downward trends in the 25-29 age bracket:
Licencing rates for people in their 70s are rising in all states (I suspect a data error for South Australia in 2016):
A similar trend is clear for people aged 80+ (Victoria was an anomaly before 2015):
[this emissions section updated on 8 January 2020 with BITRE estimates for 1975-2019]
According to the latest adjusted quarterly figures, Australia’s domestic non-electric transport emissions peaked in 2018 and have been slightly declining in 2019, which reflects reduced consumption of petrol and diesel. However it is too early to know whether this is another temporary peak or long-term peak.
Non-electric transport emissions made up 18.8% of Australia’s total emissions as at September 2019.
Here’s a breakdown of transport emissions:
A more detailed breakdown of road transport emissions is available back to 1990:
Here’s growth in transport sectors since 1975:
Road emissions have grown steadily, while aviation emissions took off around 1991. You can see that 1990 was a lull in aviation emissions, probably due to the pilots strike around that time.
In more recent years non-electric rail emissions have grown strongly. This will include a mix of freight transport and diesel passenger rail services – the most significant of which will be V/Line in Victoria, which have grown strongly in recent years (140% scheduled service kms growth between 2005 and 2019). Adelaide’s metropolitan passenger train network has run on diesel, but more recently has been transitioning to electric.
Here is the growth in each sector since 1990 (including a breakdown of road emissions):
Here are average emissions per capita for various transport modes in Australia, noting that I have used a log-scale on the Y-axis:
Per capita emissions are increasing for most modes, except cars. Total road transport emissions per capita peaked in 2004 (along with vehicle kms per capita, as above).
It’s possible to combine data sets to estimate average emissions per vehicle kilometre for different vehicle types (note I have again used a log-scale on the Y-axis):
Note: I suspect the kinks for buses and trucks in 2015, and motor cycles in 2011 are issues to do with assumptions made by BITRE, rather than actual changes.
The only mode showing significant change is cars – which have reduced from 281 g/km in 1990 to 243 g/km in 2019.
However, the above figures don’t take into account the average passenger occupancy of vehicles. To get around that we can calculate average emissions per passenger kilometre for the passenger-orientated modes:
Domestic aviation estimates go back to 1975, and you can see a dramatic decline between then and around 2004 – followed little change (even a rise in recent years). However I should mention that some of the domestic aviation emissions will be freight related, so the per passenger estimates might be a little high.
Car emissions per passenger km in 2018-19 were 154.5g/pkm, while bus was 79.4g/pkm and aviation 127.2g/pkm.
Of course the emissions per passenger kilometres of a bus or plane will depend on occupancy – a full aeroplane or bus will have likely have significantly lower emissions per passenger km. Indeed, the BITRE figures imply an average bus occupancy of around 9 people (typical bus capacity is around 60) – so a well loaded bus should have much lower emissions per passenger km. The operating environment (city v country) might also impact car and bus emissions. On the aviation side, BITRE report a domestic aviation average load factor of 78% in 2016-17.
Cost of transport
The final topic for this post is the real cost of transport. Here are headline real costs (relative to CPI) for Australia:
Technical note: Private motoring is a combination of factors, including motor vehicle retail prices and automotive fuel. Urban transport fares include public transport as well as taxi/ride-share.
The cost of private motoring has tracked relatively close to CPI, although it trended down between 2008 and 2016. The real cost of motor vehicles has plummeted since 1996. Urban transport fares have been increasing faster than CPI since the late 1970s, although they have grown slower than CPI (on aggregate) since 2013.
Here’s a breakdown of the real cost of private motoring and urban transport fares by city (note different Y-axis scales):
Note: I suspect there is some issue with the urban transport fares figure for Canberra in June 2019. The index values for March, June, and September 2019 were 116.3, 102.0, and 118.4 respectively.
Urban transport fares have grown the most in Brisbane, Perth and Canberra – relative to 1973.
However if you choose a different base year you get a different chart:
What’s most relevant is the relative change between years – eg. you can see Brisbane’s experiment with high urban transport fare growth between 2009 and 2017 in both charts.
Hopefully this post has provided some useful insights into transport trends in Australia.