Roads in Victoria are noticeably quieter, but just how much has traffic reduced? Has it varied by day of the week, time of day, and/or distance from the city centre?
To answer these questions I’ve downloaded traffic signal loop vehicle count data from data.vic.gov.au for February, March, and April 2020. The data includes vehicle detection loops at 3,760 signalised intersections across Victoria (87% of which are in Greater Melbourne).
I should state that it is not a perfect measure of traffic volume:
It may under-count motorway-based and rural travel which may cross fewer loop detectors.
There are occasional faults with loops, and I’m only able to filter out some of the faulty data (supplied with negative count values), so there is a little noise but I will attempt to wash that out by using median counts rather than sums or averages (although charts of averages show very similar patterns to charts of medians).
Some vehicles moving through an intersection might get counted at multiple loops, but I would hope this has minimal impact on overall traffic volume trends.
How have traffic volumes reduced during the pandemic?
Firstly, median 24-hour loop volumes:
Note: the actual numbers aren’t very meaningful, it is the relative numbers that matter.
Traffic volumes declined over the second half of March 2020, as more restrictions were introduced, students stopped attending schools and universities, and workers were asked to work from home if possible.
There are variances by day type and by week, so here is a chart looking changes by day of the week, relative to the week commencing 23 February (week 9):
Note: the outlier low points are public holidays, as marked.
Weekday volumes are generally down around 40% compared to week 9, while weekend volumes are down more like 50%.
However we should be careful because there is likely to be underlying seasonality in traffic volumes, and ideally we’d be comparing volumes to the equivalent week last year (a lot more data crunching required to do that).
Volumes grew slightly between weeks 16 and 18, despite no relaxation in official restrictions – perhaps as people became more complacent about the pandemic(?).
School holidays started early on Tuesday 24 March (week 13), although many students stayed home in the last days of term. School resumed on Wednesday 15 April (week 16) with most students remote learning at home.
How has traffic reduced by time of day?
The traffic signal data is presented in 15 minute intervals, generating huge amounts of detailed data (more than I could load into Tableau Public which has a limit of 15 million records). I’ve managed to load data for most days of the week for March and April 2020.
Here’s a look at the traffic volumes by time of day for Wednesdays:
You can see a significant flattening of the traditional peaks from late March. Evening traffic was down considerably but it’s a little hard to gauge this reduction the chart. So here is a chart showing traffic volume changes relative to the first week of March:
Volumes were down the most in the evenings (particularly around 9 pm) which might reflect the closure of hospitality venues, cessation of sports and reduced social activity. The AM and PM peak periods are down around 50%, while the inter-peak period has held up the most – being only down around 30%.
I should point out that this analysis compares to a baseline of a single day, and there may be some associated noise (eg weather or event impacts on particular days).
Here is the same for Fridays:
10 April was Good Friday, hence much quieter traffic with retail trading restrictions.
Late evening traffic is down even more than for Wednesdays, which probably reflects higher volumes of hospitality-related travel on Friday nights.
Here is Saturdays:
The Saturday profile shape hasn’t changed as much as weekdays, but the evenings are down most significantly.
Curiously there are several spikes in the curve in the morning – and they are the 15 minute intervals leading up to the hours of 7am, 8am, 9am, and 10am. Initially I wondered if it was a data quality issue, but perhaps they reflect a surge in travel just in time for work shifts and other activities that start on the hour.
For some reason traffic volumes were relatively low around 6 am on Saturday 7 March, which has resulted in other days showing less reduction.
Saturday night travel is down considerably – by over 70% by midnight. You can also see early Saturday morning (Friday night) travel down around 60-70%.
Here is Sundays:
Sunday 12 April was Easter Sunday, which might explain quieter traffic. Sunday 8 March was on the Labour Day long weekend (including the Moomba festival), which probably explains the much busier traffic that Sunday night (not being a “school night”). You can more clearly see that on the following chart:
One aside on this – it’s possible to compare the traffic profiles of different days of the week (sorry I had to exclude Tuesdays and Thursdays due to data volumes). Here’s the first week of March before the shutdown:
This data suggests a roughly a one hour lag on Sunday mornings compared to Saturday mornings – ie travel volumes hold up an hour later on Saturday nights and ramp up an hour later on Sunday mornings. This pattern holds up for other weeks.
Have traffic impacts been different by distance from the CBD?
Here’s a chart showing changes in traffic volumes by distance from the Melbourne CBD on Wednesdays in March and April:
The anomalies at 40-45 km is related to an unusually low volume for 4 March – it’s hard to know the cause of this, it might be a fault at some intersections, or some major roadworks that impacted some intersections.
While there is probably some noise in the data, volumes appear to have dropped slightly more for intersections closer to the CBD. But overall the reduction in traffic volumes appear to be fairly consistent across the city.
On Saturdays the relationship with distance from the CBD is a little stronger, but still small:
Central city volumes are down around 50%, while in the outer suburbs it is more like 40%. A similar pattern is evident on Sundays:
Traffic signal data comes out monthly, so I might try to update this analysis after the end of May.
There has been talk about about a boom in cycling during the COVID-19 pandemic of 2020 (e.g. refer The Age), but has that happened across all parts the city, across lanes and paths, and on all days of the week?
In Melbourne there are bicycle counters on various popular bike paths and lanes around the city (mostly inner and middle suburbs), and so I thought it would be worth taking a look at the data (which may or may not reflect total cycling activity, we don’t know).
But before plotting the data, it’s important to understand data quality. Since 2015 there have been 36 bicycle counting sites in Melbourne. But for whatever reasons, data is not available at all sites for all days. Here is the daily number of sites reporting from January 2015 to 13 May 2020 (at least with data available as of 14 March 2020).
There are notable gaps in the data, including most of the latter part of November 2017, and around mid-2018.
So any year-on-year comparison needs to includes sites that were active in both years. For my first chart I’m going to filter for sites with complete data for 2019 (all) and 2020 (to 13 May). I’ve also filtered out a few sites with unusual data (very low counts for a period of time – possibly due to roadworks).
Here is a chart showing average daily counts by month, dis-aggregated by whether the site was a bike lane (5 sites) or path (22 sites) and whether the day was a regular weekday, or on a weekend/public holiday.
Weekday bike lane travel was way down in April and May 2020, which makes sense as most of these sites are on roads leading to the CBD, and many workers who normally work in the CBD are likely to be working from home.
Traffic in bike lanes on weekends was very similar to 2019. This might reflect bike lanes not attracting additional recreational cyclists, or perhaps an increase recreational cycling is offset by a decline in commuter cycling.
Weekend path traffic was way up in April 2020, which also makes sense, as people will be looking to exercise on weekends in place of other exercise options no longer available (eg organised sports, gyms). The first half of May 2020 was a little quieter than April, which might be partly related to cooler weather (but also note the data only includes 2 weekends – at the time of extraction).
Weekday bike path traffic was down in 2020, although not as much as for bike lanes. I’ll explore this more shortly.
Here’s a look at the percentage growth at each site on weekdays. I’m comparing weeks 14-19 of years 2020 and 2019 (33 sites have complete data for both periods):
You can see significant reductions near the CBD, and on major commuter routes (lanes and paths). The biggest reduction was 71% on Albert Street in East Melbourne.
The blue squares are mostly recreational paths where there has been massive growth, the highest being the Anniversary trail in Kew at +235%! However I should point out that these growth figures are often off very low 2019 counts. It may be that people working from home (or who have lost their jobs) are now going for recreational rides on weekdays.
You might notice one square with two numbers attached – the +27% is for the Main Yarra Trail (more recreational), and the -32% is for the Gardiners Creek rail (probably more commuter orientated at that point). The two counters are very close together so the symbols overlap.
Here is the same again, but with the changes in average daily counts:
Many of the high growth percentages were not huge increases in actual volumes. The bay-side trail experienced some of the bigger volume increases.
On weekends and public holidays, there were smaller percentage reductions near the city centre, and large increases in the suburbs:
The percentage increases on weekends are not as high because there was a higher base in 2019. The reductions in the central city are smaller, but still significant – this may reflect fewer CBD weekend workers with a downturn in retail activity.
Again, here is a map of the changes in volume on weekends:
Here’s another way to view the data – sites by distance from the CBD:
Bike lane volumes are down significantly at most sites, particularly on weekdays. Bike path volumes are down on weekdays at most sites within 6 km of the CBD, but up at sites further out, and up at most sites on weekends.
I’m curious about the volume changes on paths on weekdays, so I’ve drilled down to hourly figures. Here are the relative volumes per hour:
We find that the story of bike paths on weekdays is a mix of increases during the middle of the day, and significant reductions in the peaks. The peak reductions likely reflect many people working from home, while the middle of the day increase is perhaps people breaking up the day when working from home, or people who are no longer working.
Bike lane volumes on weekdays are significantly down in the peaks and evenings, but less so in the inter-peak.
On weekends there has been little change in the already low bike lane volumes, but a substantial increase in bike path volumes – suggesting people seeking recreational riding opportunities on the weekend are choosing the much more pleasant bike path environments.
Of course this data only tells us about what’s been happening during the lock down. There may well be a boom in cycling (particularly on bike lanes) when more people start returning to work and look for alternatives to (what might be) crowded public transport.
How much have volumes reduced? How has this varied by day types, locations, and times of day? Join me as I dive into the data.
The City of Melbourne have installed 64 pedestrian counters in and around the CBD. Here’s a map of the sites and some (arbitrary) groups (which I’ll use later):
The sensors are not evenly distributed over the city, with a bias towards the central retail core, so they are unlikely to be perfectly representative of central city pedestrian activity, but the data is available and is interesting.
Of course sensors fail from time to time, so we don’t have a complete time series for all sites for all days. There have also been many more sensors added over time. Here is a chart showing the sensors reporting for each day since counting began in 2009:
To get a reasonable comparison, the following chart aggregates data from 44 measuring sites that have complete or near-complete data for 2019 and 2020 (so far):
The gaps in the lines are due to public holidays, which have been excluded (I have not coded Easter Saturday as a public holiday).
You can see volumes drop significantly from around week 12 onward in 2020 (starts Sunday 15 March), as restrictions were introduced.
You can also see significant week to week variations in volumes in 2019, so when measuring the decline I’m going to compare volumes with those in the first two weeks of March (when universities had commenced on-campus teaching).
Here are daily volumes relative to the average of the first two weeks in March:
You can see volumes down over 80% by early April, followed by some small growth. The reductions have been fairly consistent across all day types – the variation between days of February has reduced dramatically, suggesting perhaps there is a lot less discretionary pedestrian activity.
During the recovery phase there have been a few outliers:
Thursday 9 April was the day before Good Friday when most retail trading is restricted.
Wednesday 29 April was a very wet day (23.6 mm of rain)
Saturday 16 May was the first Saturday after restrictions were eased (also a fine sunny day of maximum 18 degrees).
While the Sunday decline appears to be the largest, Sunday 8 March was during the Moomba festival on a long weekend, so there were many more people in the city than normal that night, inflating the baseline.
Likewise the first two Saturdays in March had quite different volumes, which may be related to special events as well. So I would suggest not getting carried away with the exact decline percentages.
How have volumes changed in different parts of the city?
Of course the pedestrian volume reductions have not been uniform by place or day of the week. Here are the reductions on weekdays for week 14 (29 March – 4 April), when overall volumes bottomed:
Volumes were down the most around Melbourne University, and reductions of around 85% were typical in the CBD grid. There were smaller reductions in Docklands (which might reflect many pedestrians being residents), and around Queen Victoria Market (one site only down 44%).
Here’s the same again for Saturday 4 April:
The largest reductions around the arts precinct in Southbank, the retail core of the CBD, and around Melbourne University. Lesser declines are again in Docklands and around Queen Victoria Market.
And here is Sunday 5 April:
Patterns are similar again.
What are the trends in different parts of the city?
The next chart looks at the volumes trends for my sensor groups over time for weekdays:
The relative decline has been fairly consistent across the groups over the weeks, with the university sites showing the biggest declines, and the residential and retail sites showing the least decline. The retail precincts of Lygon Street, CBD central, and Melbourne Central (around the station) have shown the most growth in May.
The story is quite different on Saturdays:
There is historically a lot more week to week variation, and the numbers for Docklands have bounced around a fair bit – with 16 May close to normal levels of pedestrian activity (a dry day with maximum 18 degrees, lower days had rain). Saturday 23 May was a fairly wet day, so might have discouraged travel.
Queen Victoria Market has also shown considerable growth since early April – with volumes within the bounds of regular volumes.
Sundays are similar:
Docklands, Queen Victoria Market and Melbourne Central all increased on Sundays during May (all with little or no rain).
The fact that the Southbank / River group has shown the largest decline is probably related to it having a high base – with the Moomba festival causing a spike in pedestrian volumes on 8 March.
How have volumes changed by time of day?
Here’s the profile of hourly volumes for sites with complete data for 2020 on weekdays:
You can see the normal AM peak, lunchtime peak, and PM peak, which have been largely flattened since the pandemic hit.
If you follow the colours carefully you can see the rapid decline in late March, followed by slow growth.
Here are hourly volumes relative to the first two weeks of March:
The biggest reductions have been in the AM peak and evenings, which reflects a reduction in commuters and hospitality activity. The reductions are slightly smaller mid-morning and mid-afternoon (between the regular peaks) reflecting a flattening of the profile.
The smallest percentage reductions have been at 4-5am in the morning, off a small base.
Here is Saturdays:
Reductions have again been largest in the evenings, just after midnight (Friday night), and least around dawn. You can see more recent Saturday afternoons showing growth, but no growth in the evenings as restaurants, bars, and theatres remained closed.
Same again for Sundays:
Sunday 8 March is an outlier in the day and evening – with the Moomba festival on, and the following Monday being a public holiday.
Another way to visualise hourly data
Here’s a chart that shows pedestrian volumes for every hour of 2020 up to and including 24 May 2020. The rows are days, and the columns are hours of the day:
You can see how pedestrian activity very quickly became quiet in March. Before the shutdown you can also see the weekly patterns, with weekend activity starting later and finishing later.
The top row is New Years Day, and you can see high volumes in the first few hours from new year celebrations.
May 16th was the first Saturday after restrictions were eased and that shows up as the first spike in the recovery phase.
This can be filtered for locations. For example, here is the data for Queen Victoria Market sensors:
You can see clear stripes for days the market was open (including night markets). The first busy day after the shut down was the Thursday before Good Friday – perhaps people cramming shopping ahead of Good Friday (Easter Saturday was also busy). The market continued to trade throughout this time.
I might try to periodically update this post during the recovery.
An aside: visualising activity over a long weekend
Nothing to do with the pandemic, but a bit of fun to finish. Here is an animation of pedestrian volumes over the Labour Day long weekend 6-9 March 2020 (Friday to Monday):
If you watch carefully you’ll spot some sudden surges from a Saturday evening event at Docklands Stadium.
Young adults are much more likely to use public transport (PT) than older adults.
Is it because younger adults are more likely to live and/or work near the city centre? Is it because they are more likely to live near train stations? Is it because they tend to live in higher density areas with better public transport? Is it because they are less likely to own a car? Is it because they are less likely to own a driver’s licence? Is it because they are less likely to be parents? Is it to do with their income? Is it related to how many of them are recent immigrants? Or is it a generational thing?
The answers are not as simple as you might expect. This is the first post in a series that aims to understand what influences mode choice across different ages. I’ll focus on (pre-COVID19) data about general travel and journeys to work in my home city of Melbourne, but I suspect the patterns will be similar in comparable cities.
About the data (boring but important)
My largest data source is the 2016 ABS census of population and housing which provides detailed demographic data about residents, captures the modes used for journeys to work, but doesn’t record travel for any other purposes and only covers a single day in August. There’s data on the travel choices of millions of people, and so it is possible to disaggregate data by several dimensions before you run into problems with small counts.
For general travel mode shares my data source is the Victoria Integrated Survey of Travel and Activity (VISTA) which is Victoria’s household travel survey, recording the transport and activity of a representative sample of Melbourne and Geelong residents across the whole year. The data set is smaller than the census (being a survey), but also contains rich demographic information and covers all travel purposes by people of all ages. I have used aggregated data over the survey years 2012-2018 to form a larger sample, so any underlying trends in behaviour over that period will be averaged out.
For this analysis I am filtering my data to either Greater Melbourne (for 2011 and 2016 census data) or otherwise the 31 local government areas (LGAs) that make up metropolitan Melbourne (all are entirely inside Greater Melbourne except Yarra Ranges).
All of this data was collected before the COVID19 pandemic, and of course travel patterns may well not return to similar patterns once the pandemic is over.
Consistent with elsewhere on this blog, I attribute
any journey involving a train, tram, bus, or ferry as a public transport journey (even if other modes were also used, including private transport),
a journey only involving walking and cycling as an active transport journey, and
any other journey as a private transport journey (mostly being car journeys).
This post mostly focuses on public transport – which I will often abbreviate to PT.
While the data sets I am using only identify sex as male or female, I want to acknowledge that not all people fit into binary classifications.
How does PT mode share vary by age and sex for general travel?
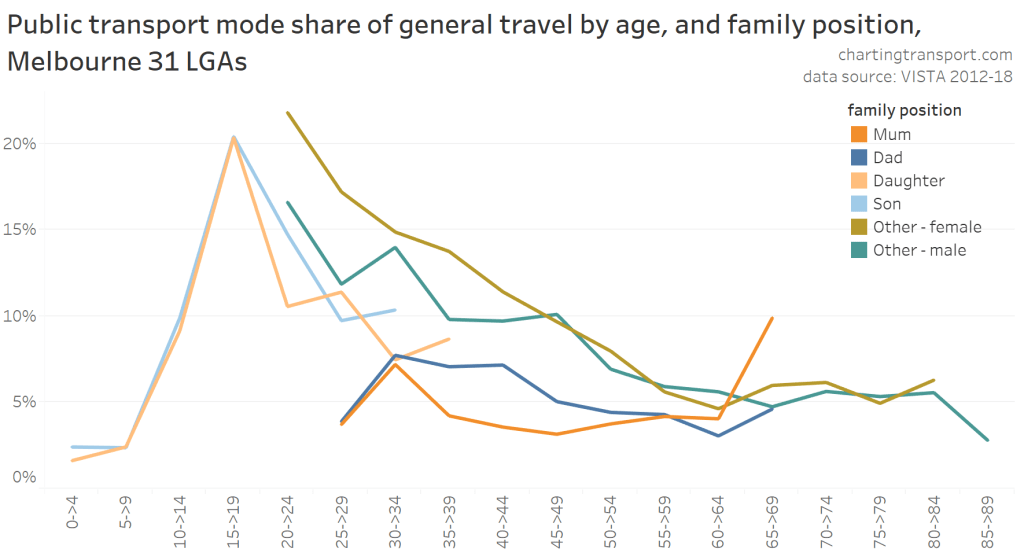
Here’s a chart showing public transport mode shares by age and gender using VISTA data for all travel purposes:
Public transport mode share peaked in the 15-19 age group – essentially around the later years of secondary school and early years of tertiary education or working life where people have more independence, may need to travel longer distances to get to school or university, and are too young and/or cannot afford private transport.
Public transport mode share then fell away with age, though the profile by gender is slightly different (some of this may be noise in the survey). Women under the age of 30 were more likely to use PT, but then they became less likely to use PT after age 30 – perhaps after the arrival of children.
Children under 10 years were least likely to use public transport, and there was only a small increase in public transport use amongst women aged over 65. Public transport use dropped considerably for those aged 85-89, and there wasn’t sufficient sample to confidently calculate mode shares for any older age groups.
How does PT mode share vary by age and sex for journeys to work?
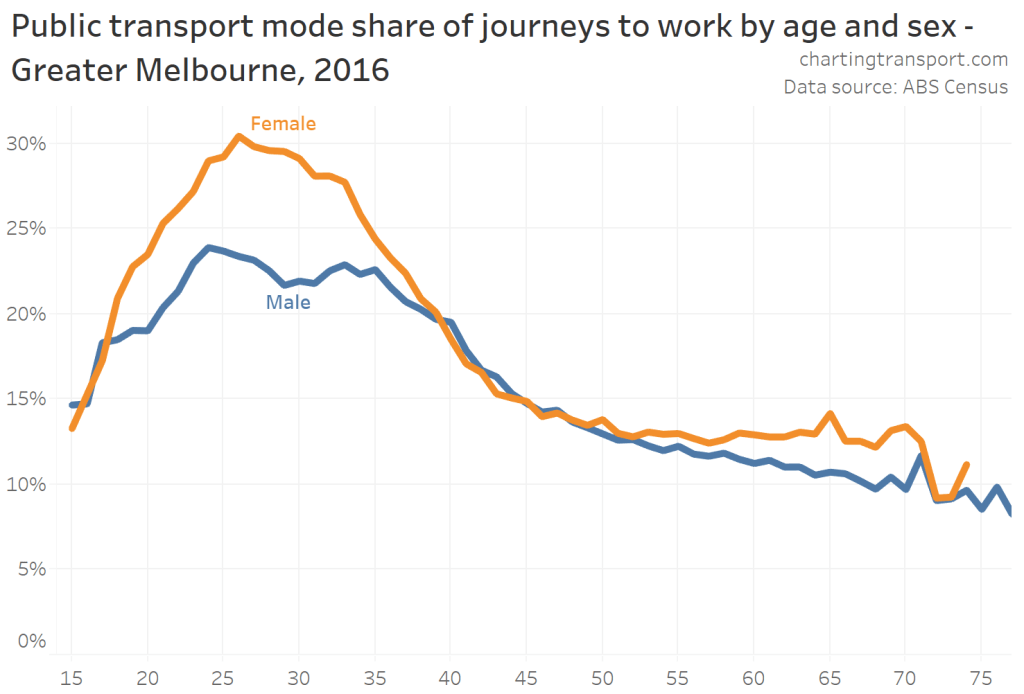
Here is a chart of public transport mode share of journeys to work in Greater Melbourne by age and sex (using census data):
The chart shows women were much more likely to use public transport to get to work than men, particularly for young adults but also those in their 60s. Overall PT mode share was 17.7% for males and 20.3% for females. PT mode share peaked for females at age 26, and for males at age 24.
So what might explain the variations across age and gender? In this first post I’m going to explore the how mode share varies by home and work distance from the CBD.
For travel to/from the City of Melbourne, PT mode shares peaked around 50% for workers in their early 20s, and generally fell away with age, with females showing a higher PT mode share in all age groups (mode shares are only shown for ages 20-64 due to small samples of trips in other age groups).
For travel not to/from the City of Melbourne, PT mode shares peaked for teenagers and was very low for all other age groups, with only slightly higher mode shares for those in their 20s, early 30s, and early 80s.
With census journey to work data, we can increase the resolution to 2 year age-bands and dis-aggregate work destinations by distance bands from the CBD. The darker line of each colour is for females, the lighter for males.
Public transport mode share was much higher for workplaces near the CBD, and then declined with workplace distance from the CBD.
But within each workplace distance band from the CBD there was also a generally declining PT mode share with age, flattening out somewhat for ages above 45. While there was a difference between genders at all workplace distance bands, it was generally smaller than the overall mode share difference between genders for journeys to work.
How can these lines have quite a different curve shape to overall PT mode share by age/sex? Well, here is a chart showing the proportion of Greater Melbourne workers at every age who worked within 4 kms – and within 10 kms – of the Melbourne CBD:
Young adults were much more likely to work closer to the CBD than older adults, and women even more so (although they are not actually a majority of workers close to the CBD).
Teenagers were least likely to work in the City of Melbourne, which likely reflects their lack of qualifications for high-skill jobs that tend to locate in the central city.
The curves for men and women peaked at different ages, with younger adult women more likely to work in the City of Melbourne than younger adult men, which then flipped for ages 38+. This isn’t because of stay-at-home mums because the data only counts people who travelled to work.
Here’s another look at that data – showing the distribution of work locations from the CBD for age bands. Around 40% of young adult workers worked within 6 km of the CBD:
And flipping that, workplaces closer to the CBD have a higher proportion of younger adults:
Public transport mode shares for general travel (in the VISTA survey) were related to both age and trip destination distance from the CBD, with those in their 50s least likely to use PT for destinations within 5 km of the CBD:
So a major explanation why younger adults were more likely to use public transport in their journey to work is that they were more likely to work in the central city. However, when you control for travel proximity to the CBD there is still a significant relationship between PT mode share and age – other factors must be at play.
I’m curious – is the fact that younger adults (particularly women) were more likely to work in the city centre related to their…
Educational qualifications
Well, younger adults turn out to have the highest educational qualifications of any age group, with those in their early 30s generally being the most qualified (as at 2016):
Note: Supplementary codes includes people with no educational attainment.
Furthermore, younger women are generally more qualified than younger men, which could explain why a higher proportion of younger women work in the City of Melbourne, and therefore have a higher public transport mode share overall.
[As an aside: I find that chart fascinating – there’s been a generational shift in educational attainment which will continue to work it’s way up the age brackets in the decades ahead, resulting in an increasingly skilled workforce over time. Part of this will be skilled migration, part may be temporary migrants (eg international postgraduate students), and another part presumably reflects greater access to higher education in recent decades.]
Looking to the future perhaps this cohort of highly educated young adults will continue to work in the inner city as they age, along with younger skilled graduates, leading to more centralisation of employment in Melbourne as we become more of a “knowledge economy”? Or maybe the recent mass working-from-home experience of highly skilled workers during the COVID-19 pandemic will see more workers based in the central city but travelling to their workplace less often.
But back to the how education levels impact work location and mode choice…
People with higher educational attainment are more likely to work closer to the CBD:
The chart shows around half of workers with postgraduate degrees worked within 4 km of the CBD, whereas those who didn’t complete secondary education were much more likely to work in the suburbs.
We know that workplace distance from the CBD impacts PT mode shares, but does varying educational qualifications explain the differences in mode share between ages?
The following animated chart shows how PT mode shares for journeys to work vary by age for people with the same level of educational qualifications and working the same distance from the Melbourne CBD. I have animated the chart across workplace distance from the CBD bands.
If you watch and study the chart, you’ll see that there is a relationship between age and PT mode share for most combinations of educational attainment and workplace distance from the CBD. That is, age is significant in itself, or there is some other explanation for mode share difference by ages.
You’ll also see that public transport mode shares were generally higher for higher levels of educational attainment, with postgraduate degrees mostly showing the highest public transport mode share.
Here’s an alternative, non-animated view of that data. It’s a matrix of mini line charts showing PT mode share by age, for each combination of workplace distance from the CBD and highest level of educational attainment. You could call it a matrix of worms. The light horizontal line within each matrix box represents a 50% PT mode share, and the colours give you a rough sense of age (refer legend). I don’t expect you to be able read the mode share values for any age band on any line, but it does show PT mode shares falls with rising age for all education levels and workplace distances from the CBD (except some further out where PT mode share is just very low for all ages).
Here is yet another view: the relationship between PT mode share, workplace distance from the CBD, and highest level of educational attainment. I have roughly sorted the education levels by PT mode share, rather than ordering by level of qualification.
PT mode shares were not directly proportional to education levels, but I suspect this will be partly related to occupations – eg Certificate III and IV qualifications often related to trades where driving to non-centralised work sites is a more convenient option.
Those with postgraduate degrees generally showed the highest public transport mode share at each distance interval.
So we’ve explored work distance from the CBD, but what about…
Home distance from CBD
Younger adults were more likely to live closer to the Melbourne CBD compared to other age groups:
Public transport service quality is generally higher closer to the CBD, so does the fact that younger adults were more likely to live closer to the city explain their higher PT mode shares?
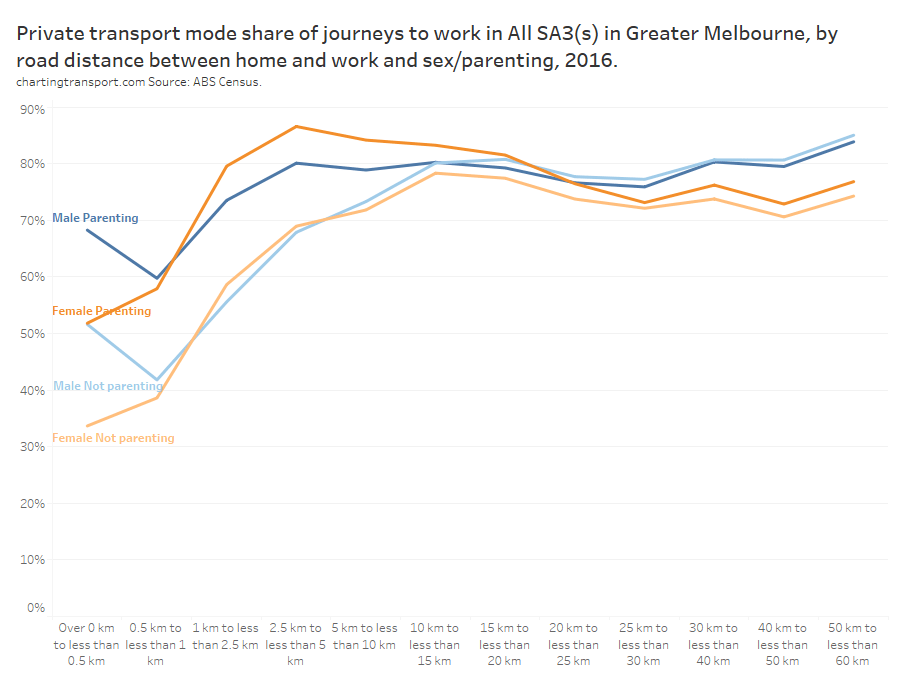
The following chart shows how public and active transport journey to work mode shares vary by home distance from the Melbourne CBD:
Public transport mode shares show a relationship with both home distance from the CBD and age – with mode shares peaking for ages 20-39, and dropping with older age bands. I’ve plotted active transport mode shares as well (for interest), which shows teenage workers much more likely to get to work by active transport – which makes sense as many of them will be below driving age and/or unable to afford private transport. Curiously those aged 70-79 who live in the suburbs are slightly more likely to walk to work.
Okay, but people who live closer to the CBD are more likely to work closer to the CBD, as the following chart shows:
Or another way of looking at it:
While the distance bands vary on each axis (more intervals for work distances from the CBD), you can see a very common scenario is that people’s work is a very similar distance from the CBD as their home. That is, they work relatively locally (for more on this, see Introducing a census journey to work origin-destination explorer, with Melbourne examples)
The following chart looks at mode shares for those who worked within 2 km of the CBD:
PT mode shares for these commuters were relatively high and flat for workers who live more 5 km from the CBD (those closer are more likely to use active transport – as per the bottom half of the chart). PT mode shares rose slightly with distance from the CBD for home distances 25-40 km from the CBD. But there was still a difference between age bands, with younger adults more likely to have used PT to get to work, regardless of how far from the CBD they lived.
So are there still PT mode share differences by age if you control for both home and work distance from the CBD?
Home AND work distance from the CBD
Firstly, here are PT mode shares for journeys to work by home and work distance from the CBD, animated over age bands:
Technical notes: the chart only shows mode shares where at least 200 people fell within the age and distance bands – which is quite a low threshold so there is a little noise – so please try not to get distracted by small differences in numbers. For teenagers and those aged 60-69, many combinations failed this threshold so are left blank.
The chart shows that work distance from the CBD is a very strong driver of mode shares at all age bands. Home distance from the CBD is much weaker driver of PT mode share – and only really significant for those living within 5 km of the CBD, and those under 40 years within 15 km of the CBD.
If the animation is hard to follow, here’s another matrix-of-worms chart. It shows PT mode share by age band – for every combination of home and work distance from the CBD.
The thin horizontal lines within each square of the matrix represent 50% PT mode share. While you cannot read off the PT mode shares for any age and distance combination, you can see that within each pane PT mode share either generally fell with increasing age, or were very low for all ages. That is to say, that home and workplace distance from the CBD doesn’t fully explain the relationship between age and PT mode shares for journeys to work. Other factors must be at play.
The above chart makes it hard to compare mode shares for the different work distances from the CBD, so here is a transposed version with work distances as rows and home distances as columns:
There’s not a lot of difference between home distance bands for each work distance band, except for younger adults living closer to the CBD and working in the city centre. This confirms the earlier finding that work distance from the CBD is a much stronger determinate in PT mode shares.
So in summary, younger adults are more likely to live and work closer to the CBD, and that is likely related to them generally having higher educational qualifications. While these factors generally lead to higher public transport use, we’ve found they don’t fully explain why younger adults have higher public transport mode shares.
Further posts in this series will look at other demographic factors that may explain these differences. Read on to part two.
This is the second post in a series that explores why younger adults are more likely to use public transport (PT) than older adults, with a focus on the types of places where people live and work, including proximity to train stations, population density, job density, motor vehicle ownership and driver’s licence ownership.
In the first post, we found younger adults in Melbourne were more likely to live and work close to the CBD, but this didn’t fully explain why they were more likely to use public transport.
This analysis uses 2016 ABS census data for Melbourne, and data for the years 2012-18 from Melbourne’s household travel survey (VISTA) – all being pre-COVID19. See the first post for more background on the data.
Proximity to train stations
Melbourne’s train network is the core mass rapid transit network of the city offering relatively car-competitive travel times, particularly for radial travel. It’s not Melbourne’s only high quality public transport, but for the want of a better metric, I’m going to use distance from train stations as a proxy for public transport modal competitiveness, as it is simple and easy to calculate.
In 2016 younger adults (and curiously the elderly) were more likely to live near train stations:
Almost 40% of people in their 20s lived within one km of a station. Could this partly explain why they were more likely to use public transport?
Well, maybe partly, but public transport mode shares of journeys to work were quite different between younger and older adults at all distances from train stations:
Public transport mode shares fell away with distance from stations, and age above 20 (the 15-19 age band being an exception).
With VISTA data we can look at general travel mode share by home distance from a train station:
There’s clearly a relationship between PT mode share and proximity to stations, but there’s also a strong relationship between age and PT use, at all home distance bands from train stations.
Younger adults were also more likely to work close to a train station. Indeed 46% of them worked within about 1 km of a station:
And unsurprisingly people who work near train stations are also more likely to live near train stations:
The chart shows around 70% of people who worked within 1 km of a station lived within 2 km of a station. Also, 37% of people who worked more than 5 km from a station, also lived more than 5 km from a station.
But again, journey to work PT mode shares varied by both age and workplace distance from a train station:
For completeness, here is another matrix-of-worms chart looking at journey to work PT mode shares by age for both work and home distances from train stations:
PT mode share declined with age for most distance combinations, but this wasn’t true for the 15-19 age band, particularly where both home and work were within a couple of kms of a station. We know from part one that teenagers are much less likely to work in the city centre, so this might represent teenagers who happen to live near a station, but work locally and can easily walk or cycle to work.
If we take age out for a moment, here is the relationship between PT mode share of journeys to work and both home and work distance from train stations:
The relationship between PT mode share and work distance from a train station is much stronger than for home distance from a station.
So while home and work proximity to train stations influenced mode shares, it doesn’t fully explain the variations across ages. So what if we combine…
Work distance from the CBD, home distance from a train station
Work distance from a station is strongly related to work distance from the CBD, as the CBD and inner city has a higher density of train stations:
I expect workplace proximity to a train station to be a weaker predictor of mode share when compared workplace distance from CBD. That’s pretty evident when looking at journey to work PT mode share by place of work on a map:
And even more evident when you look at PT mode shares for both factors (regardless of age):
So perhaps work distance from the CBD, and home distance from a train station might be two strong factors for mode share? If we control for these factors, is there still a difference in PT mode shares across ages?
Time for another matrix of worms:
The chart shows that even when you control for both home distance from a station, and work distance from the CBD, there is still a relationship with age (generally declining PT mode share with age, with teenagers sometimes an exception). So there must be other factors at play.
Population density
Consistent with proximity to train stations and the CBD, younger adults are more likely to live in denser residential areas:
Higher residential density often comes with proximity to higher quality public transport. Indeed, here is the distribution of population densities for people living at different distances from train stations:
The next chart shows the relationship between residential density and mode shares – split between adults aged 20-39 and those aged 40-69:
The chart shows that both age and residential density are factors for journey to work mode shares. Younger adults had higher public transport mode shares for journeys to work at all residential density bands.
Similarly, VISTA data also shows PT mode shares vary significantly by both age and population density for general travel:
Technical note: data only shown where age band and density combination had at least 400 trips in the survey.
Curiously, people in their 60s living in areas with densities of 50-80 persons/ha were more likely to use public transport to get to work than those in their 40s and 50s living in the same densities (maybe due the presence of children?). For lower densities, PT mode share generally declined with increasing age (from 20s onward).
Population density is also generally related to distance from the CBD:
And here is a chart showing how PT mode share of journeys to work varied across both:
The chart shows home distance from the CBD had a larger impact on mode shares than population density. Indeed population density only seemed to have a secondary impact for densities above 40 persons/ha. However, as we saw in the first post, people living closer to the CBD were more likely to work in the city centre, and therefore more likely to use public transport in their journey to work.
Job density
Young adults were more likely to work in higher density employment areas in 2016, where public transport is generally more competitive (with more expensive car parking):
But yet again, there is a difference in mode shares between age groups regardless of work location job density:
So job density doesn’t fully explain the difference in PT mode shares across age groups.
I should add that job density is also strongly related to workplace distance from the CBD:
and workplace distance from train stations:
And putting aside age, PT mode shares for journeys to work are related to both workplace distance from the CBD and job density:
PT mode shares are also related to both job density and workplace distance from stations:
You might be wondering about the dot of higher job density (200-300 workers/ha) that is between 3 and 4 km from a train station. It’s one destination zone that covers Doncaster Westfield shopping centre – a large shopping centre on a relatively small piece of land (almost all of the car parking is multistory – see Google Maps)
Motor vehicle ownership
Are younger adults more likely to use public transport because they are less likely to own motor vehicles?
With census data, it is possible to measure motor vehicle ownership on an SA1 area basis by adding up household motor vehicles and persons aged 18-84 (as an approximation of driving aged people) and calculating the ratio. Of course individual households within these areas will have different levels of motor vehicle ownership.
Using this metric, young adults were indeed more likely to live in areas which have lower levels of motor vehicle ownership (in 2016):
But yet again, the PT journey to work mode shares varied between younger and older adults regardless of the levels of motor vehicle ownership of the area (SA1) in which they live:
Using VISTA data, we can calculate motor vehicle ownership at a household level. I’ve classified households by the ratio of motor vehicles to adults.
VISTA data shows PT mode shares strongly related to both age and motor vehicle ownership (I’ve shown the most common ratios):
You might be wondering why I didn’t calculate motor vehicle ownership at the household level for census data. Unfortunately it’s not possible for me to calculate the ratio of household motor vehicles to number of adults because ABS TableBuilder doesn’t let me combine the relevant data fields (for some reason).
The best I can do is the ratio of household motor vehicles to the usual number of residents (of any age). The usual residents may or may not include children under driving age – we just don’t know.
Nevertheless the data is still interesting. Here is how public transport mode shares of journeys to work varied across different vehicle : occupant combinations for households in Greater Melbourne:
Yes that’s a lot of squiggly lines – but for most combinations (excluding those with zero motor vehicles) there was a peak of PT mode share in the early 20s, and then a decline with increasing age.
The lines with green and yellow shades – where the ratio is around 1:2 or 1:3 – show a sharp drop around the mid 20s. I expect these lines are actually a mix of working parents with younger children, and working adult children living with their (older) parents. The high mode shares for those in their early 20s could represent many adult children living with their parents (but without their own car), while those in their 30s and 40s are more likely to be parents of children under the driving age. So the sharp drop is probably more to do with a change in household age composition.
If we want to escape the issue of children, the highest pink line is for households with one motor vehicle and one person (so no issues about the age of children because there are none present) – and that line has a peak in PT mode share in the mid 30s and then declines with age, suggesting other age-related factors must be in play.
But motor vehicle ownership levels aren’t only related to age. They are strongly related to population density,
..home distance from the CBD,
..and home distance from train stations:
And public transport mode shares are related to both motor vehicle ownership rates and population density (with motor vehicle ownership probably being the stronger factor):
Technical note: for these charts I’ve excluded data points with fewer than 5 qualifying SA1s to remove anomalous exceptions.
Public transport mode shares are also related to both motor vehicle ownership and home distance from the CBD:
And shares are also related to both motor vehicle ownership and home distance from a train station:
In all three cases, PT mode shares fell with increasing levels of motor vehicle ownership, but this effect mostly stopped once there were more motor vehicles than persons aged 18-84.
Drivers licence ownership
I’ve previously shown on this blog that people without a full car driver’s licence are much more likely to use public transport, which will surprise no one. So are younger adults less likely to have a driver’s licence?
VISTA data shows us that younger adults are indeed less likely to have a car driver’s licence, with licence ownership peaking around 97% for those in their late 40s and early 50s, and only dropping to 91% by age 75 (there is a little noise in the data):
So the lack of a driver’s licence by many young adults will no doubt partly explain why they are more likely to use public transport.
Consistent with VISTA, data from the BITRE yearbooks also shows that younger adults have become less likely to own a licence over time:
At the same time, those aged 60-79 have been more likely to own a licence over time.
But do public transport mode shares vary by age, even for those with a solo driver’s licence? (by solo, I mean full or probationary licence). The following chart shows public transport mode shares for age bands and licence ownership levels (data points only shown where 400+ trips exist in the survey data).
PT mode shares peaked for age band 23-29 for most licence ownership levels, including no licence ownership (there isn’t enough survey data for people older than 22 with red probationary licences – the licence you have for your first year of solo driving).
As an aside, there is a curious increase in public transport mode share for those aged over 60 without a drivers licence – this may be related to these people being eligible for concession fares and occasional free travel with a Seniors Card (if they work less than 35 hours per week).
So even younger adults who own a driver’s licence are more likely to use public transport.
But is this because they don’t necessarily have a car available to them? Let’s put the two together…
Motor vehicle and driver’s licence ownership
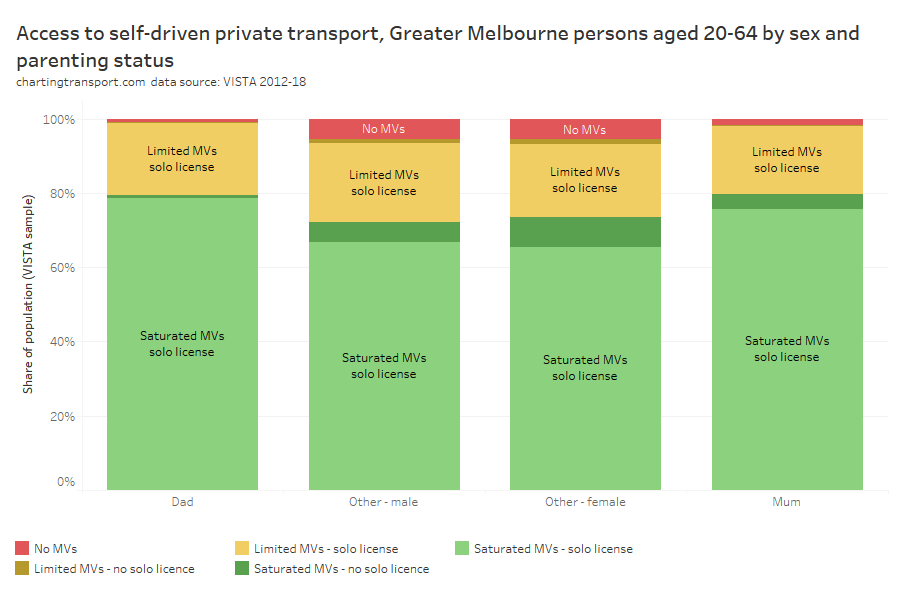
For the following chart I’ve classified households as:
“Limited MVs” if there were more licensed drivers than motor vehicles attached to the household,
“Saturated MVs” if there was at least as many motor vehicles as licensed drivers, and
“No MVs” if there were no motor vehicles associated with the household.
If there were any household motor vehicles I’ve further disaggregated by individuals with a solo licence and those without a solo licence (the latter may have a learner’s permit). I’ve only shown data points with at least 400 trip records in the category to avoid small sample noise (I am reliant on VISTA survey data).
Except for households with no motor vehicles, public transport mode share peaked for age band 18-22 or 23-29 and then declined with increasing age. So again there must be other age-related factors. However the impact of age is smaller than that of motor vehicle ownership and licence ownership.
Unfortunately driver’s licence ownership data is not collected by the census, so it is not possible to combine it with other demographic variables from the census.
Summary
So, what have we learnt in part two:
Younger adults are more likely to work and live near train stations, but that only partly explains why younger adults are more likely to use public transport.
Workplace distance from the CBD has a much bigger impact on public transport mode shares for journeys to work than home distance from a train station.
Younger adults are more likely to live in areas with higher residential density, but this only partly explains why they are more likely to use public transport.
Younger adults are more likely to work in areas with higher job density but this is highly correlated with workplace distance from the CBD, which is a stronger factor influencing mode shares.
Younger adults are more likely to live in areas with lower motor vehicle ownership (these areas are generally also have higher residential density and are closer to the city centre and to train stations), but this again only partly explains why they are more likely to use public transport. Motor vehicle ownership appears to be a stronger factor influencing mode shares than population density, distance from stations, or distance from the city.
Younger adults are less likely to have a driver’s licence, but again this only partly explains why they are more likely to use public transport.
While this analysis confirms younger adults tend to align with known factors correlating with higher public transport use, we are yet to uncover a factor or combination of factors that mostly explain the differences in public transport use between younger and older adults. That is, when we control for these factors we still see differences in public transport use between ages.
The next post in this series will explore the impacts on public transport use of parenting responsibilities, generational factors (birth years), and year of immigration to Australia.
I’ve been exploring data to explain why younger adults are more likely to use public transport (PT) than older adults in Melbourne. This third post in a series looks at the relationship between public transport mode share and parenthood, the year in which people were born, whether people were born in Australia or overseas, and how recently immigrants arrived in Australia.
I’m using VISTA household travel survey data (all travel) and ABS Census data (journey to work only). For more detail about the data, see the first post in the series.
Parenthood
Are younger adults more likely to use public transport because they don’t (yet) have dependent children?
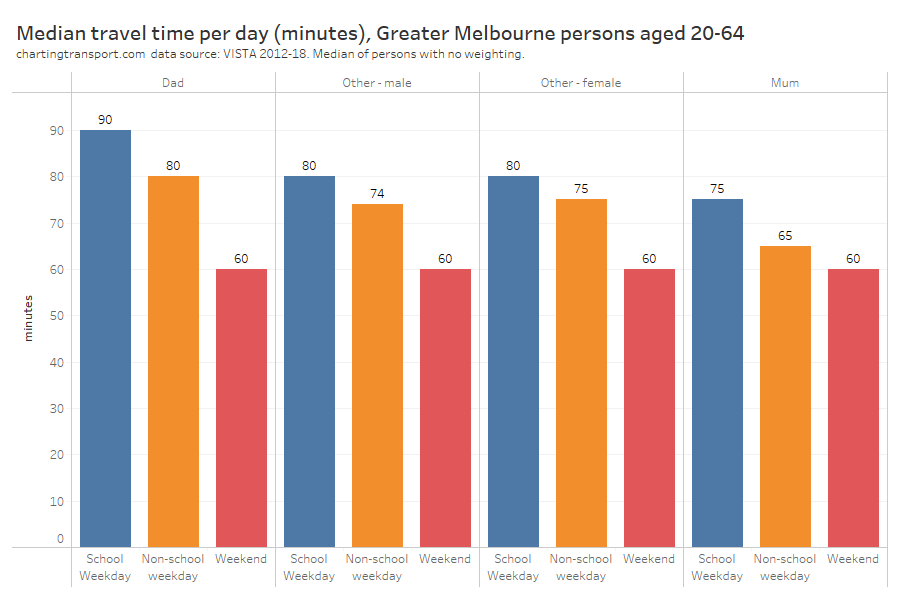
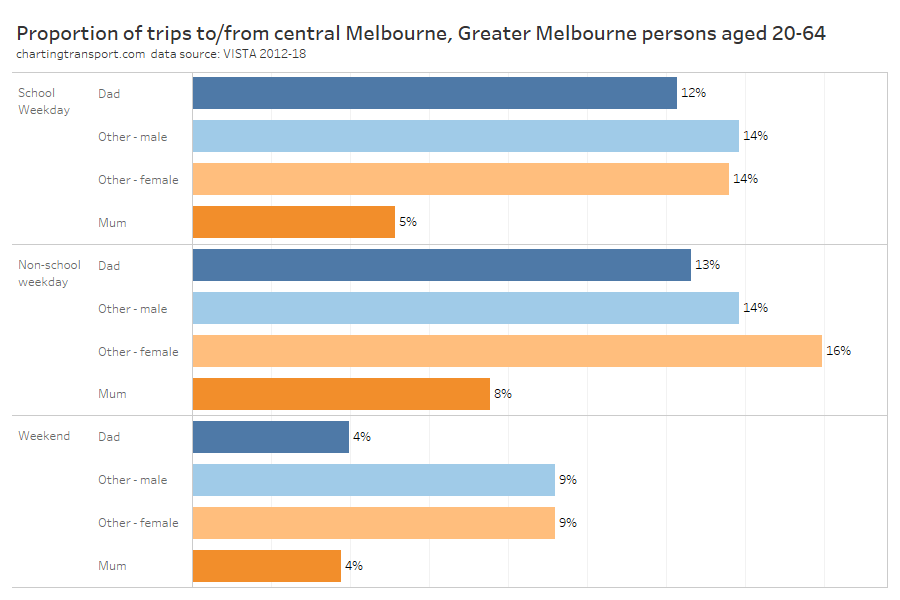
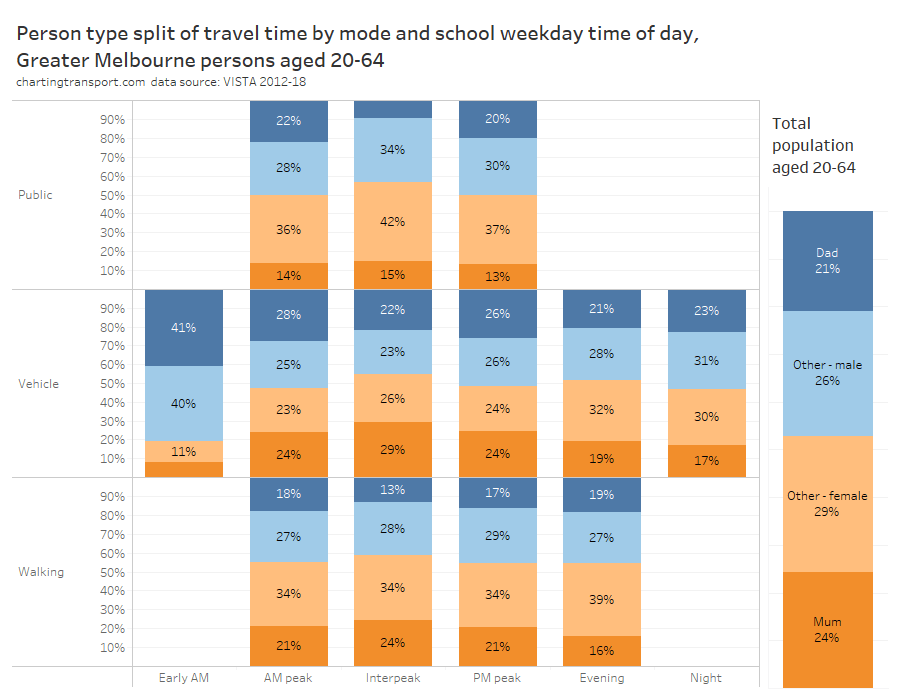
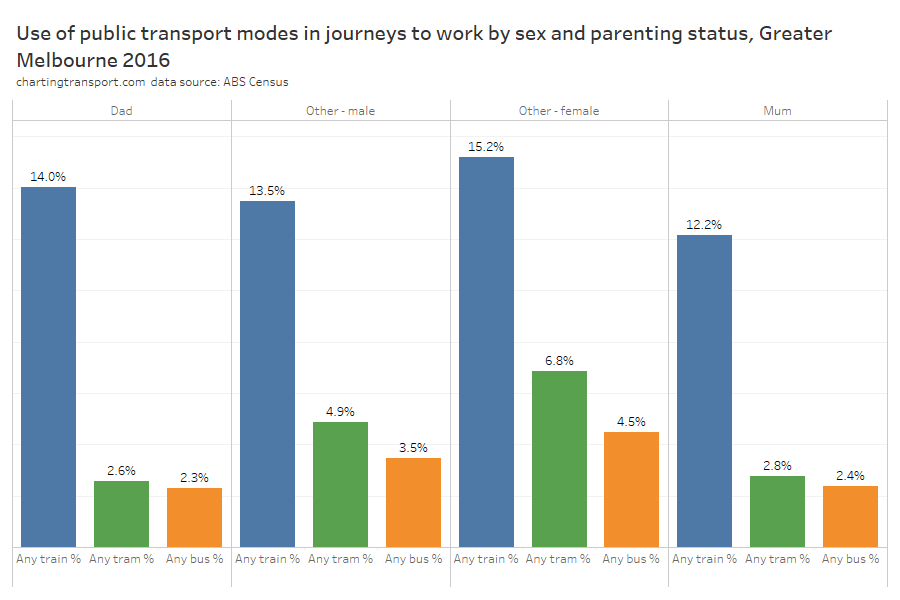
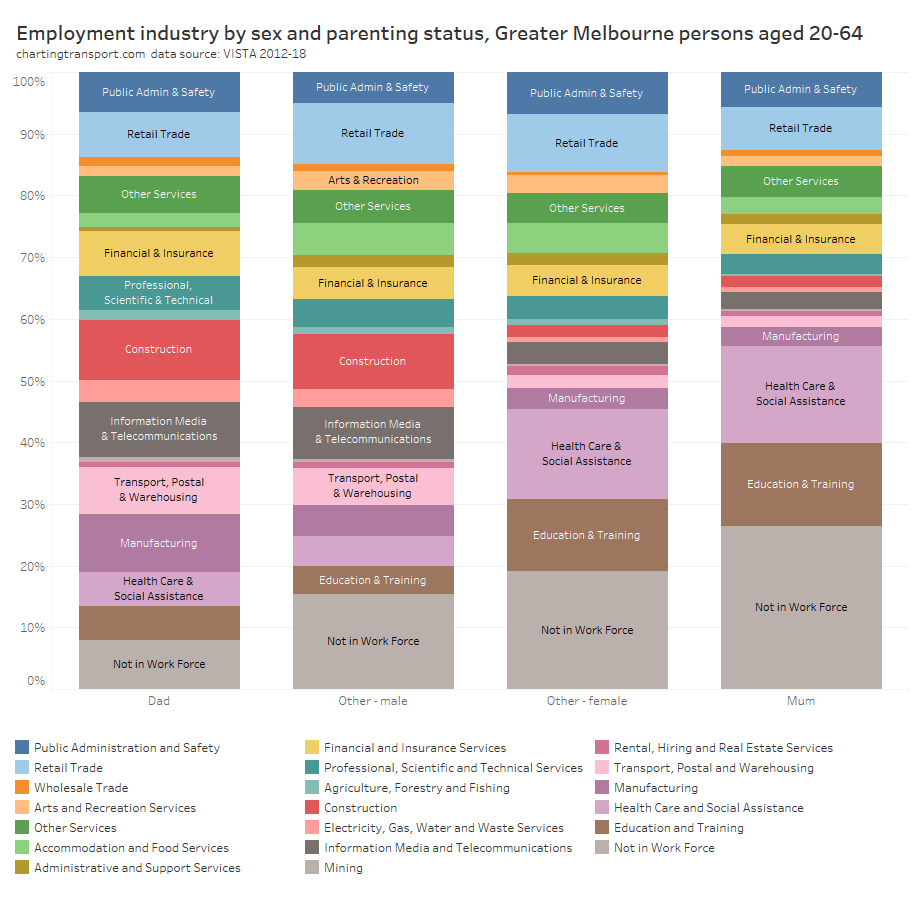
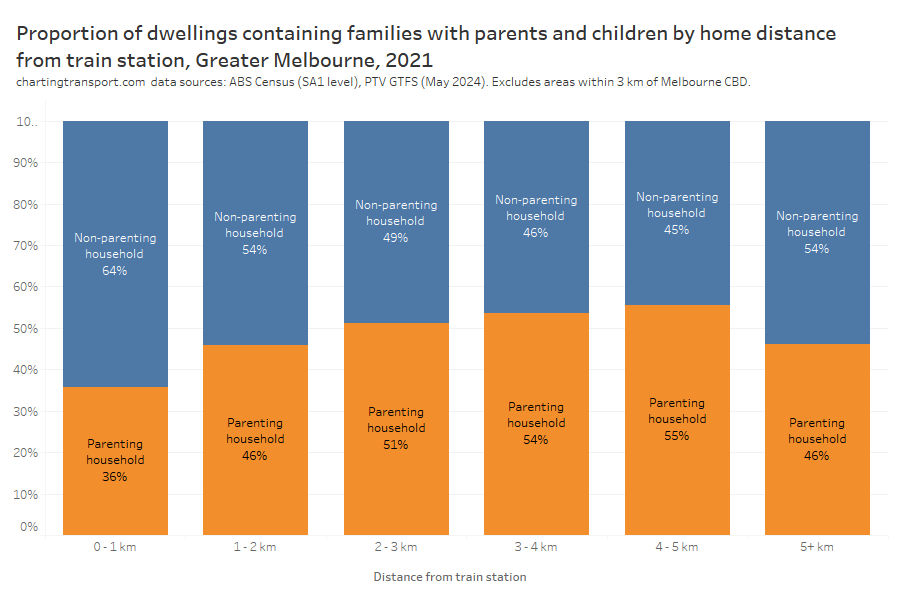
Consistent with previous analysis on this blog, there is a relationship between PT mode share and whether people are parents within family households. Here’s the data for general travel from VISTA 2012-18:
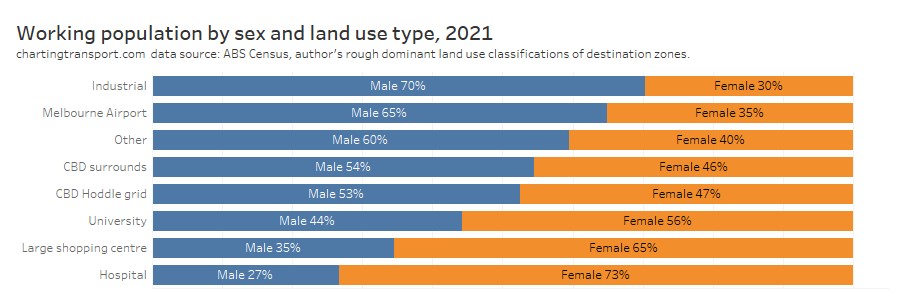
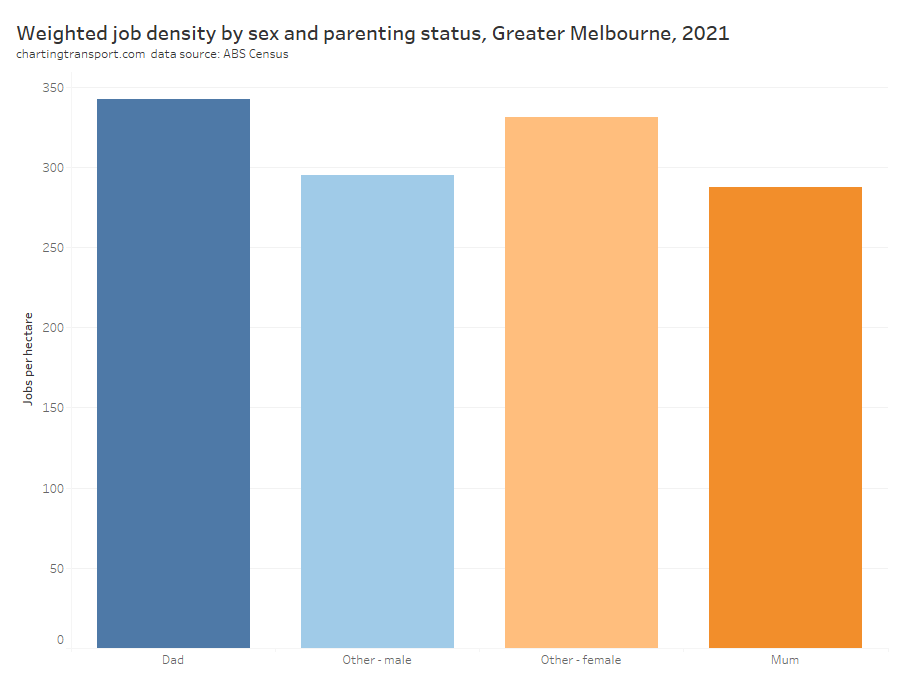
Parents were much less likely to use public transport than non-parents of the same age, with mums between 35 and 55 having a lower mode share (on average) than dads in the same age range.
The census tells us whether a worker did unpaid child care for a child of their own in the two weeks prior to the census, which I am using to distinguish parents and non-parents.
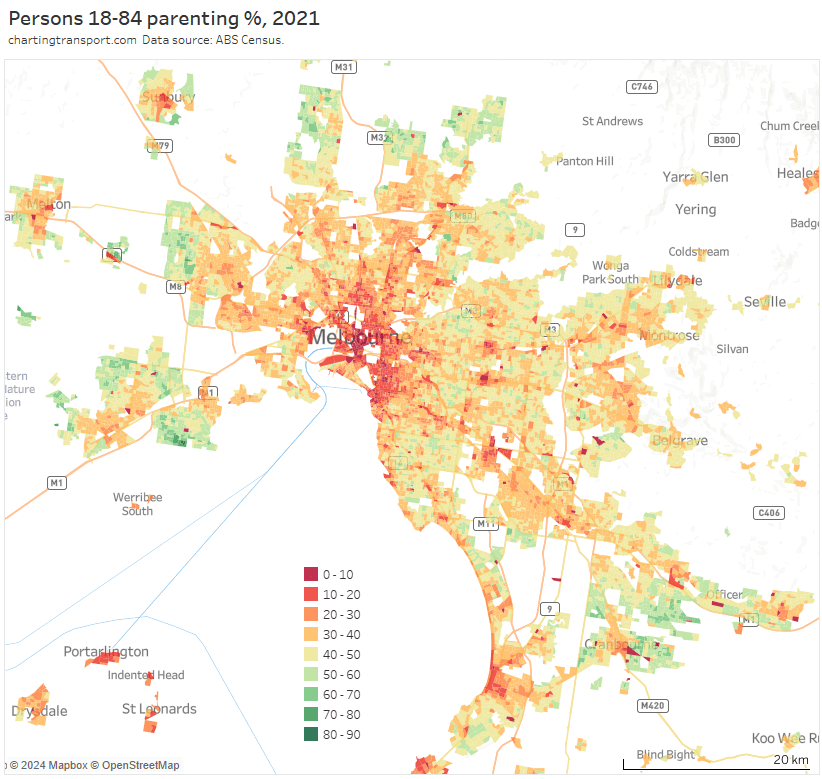
The following chart shows the proportion of working men and women who were parents, animated over censuses 2006 to 2016.
Parenting peaked around age 40 for male and female workers, and the proportion of workers who were parenting went up between 2006 and 2016.
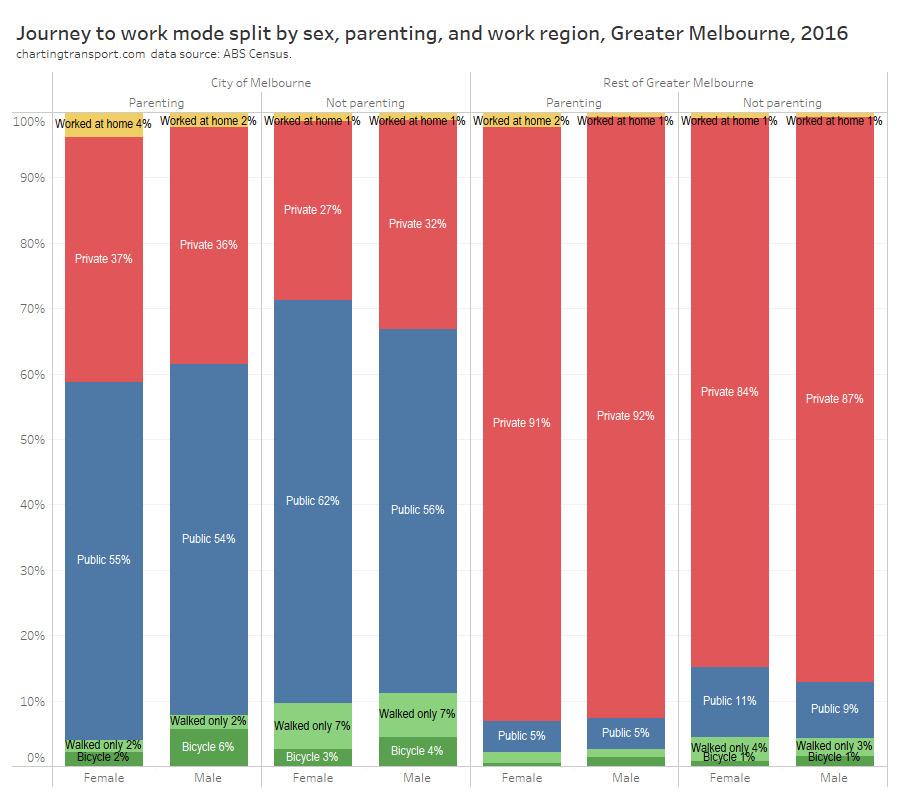
So how do public transport mode shares vary by age if we separate out parents and non-parents? The following chart answers this, and also separates workers by whether or not they worked in the City of Melbourne local government area (a known major factor influencing mode shares), animating results over 2006, 2011, and 2016:
Note there is a different Y-axis scale for City of Melbourne and elsewhere.
There are a few really interesting take-aways here:
Parenting workers mostly had lower public transport mode shares than non-parenting workers of the same age, except for:
dads over 30 who worked in the City of Melbourne,
mums in their early 30s who worked in the City of Melbourne in 2016, and
mums and dads in their 50s who worked outside the City of Melbourne (who had low PT mode shares around 4-5%, similar to non-parenting workers of the same age)
Public transport mode shares increased over time for almost all age bands, work locations, and for parenting and non-parenting workers.
Public transport mode shares for journeys to work in the City of Melbourne mostly declined with increasing age between 20 and 50, regardless of parenting responsibilities. Other age-related factors must be at play.
For people who worked outside the City of Melbourne, the mode share profile across age changed significantly over time for young adults. In 2006 there was a steady decline with age, but in 2011 PT mode shares were generally flat for those in their 20s, and in 2016 PT mode shares peaked for women in their late 20s (and also had a quite new pattern for dads in their 20s).
For parenting workers who work outside the City of Melbourne there was actually a slightly higher PT mode share for those over the age of 50. Parents over 50 might have older children who are more independent and therefore less reliant on their parents for transport. This might make it easier for the parents to use public transport. However this trend did not hold for dads in 2016.
PT mode shares for non-parenting women increased slightly beyond age 55 for all work locations. This will include women who were never parents, as well mums with non-dependent children so might again reflect a small return to public transport once children become independent. It may also be influenced by discounted PT “Seniors” fares available to people over 60 who are not working 35+ hours per week.
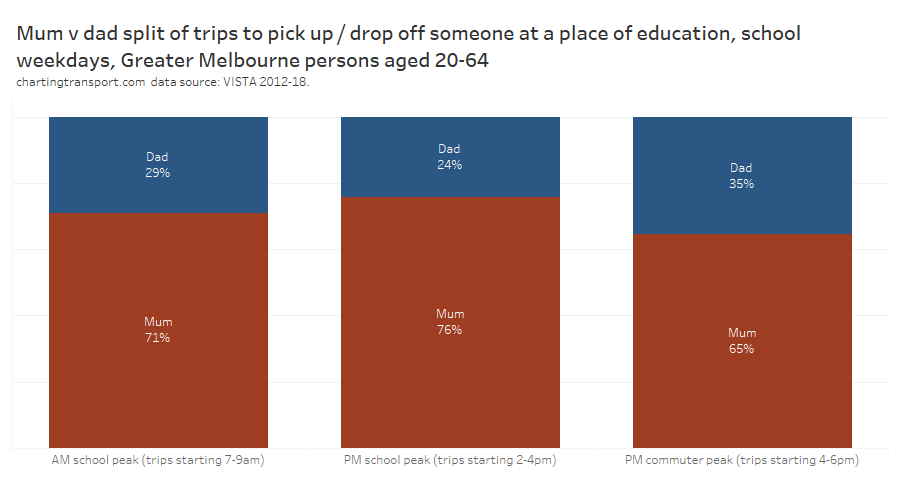
Lower public transport mode shares for parents is not surprising – they may be more time-poor and need more transport flexibility to link trips – eg dropping kids at childcare on the way to work can be more difficult with public transport (although it doesn’t seem to impact men travelling to the city centre nearly as much as women – I suspect because women are more likely to be working part time and doing childcare drop-offs and pick-ups). Parents may decide that time saving and convenience moving children is more important to them than lower transport costs from using PT.
However, addition of parenting responsibilities does not fully explain why public transport mode share generally declined with increasing age, particularly for non-parenting workers.
But I’m curious about the changing profile of mode share by age over time. Could it be influenced by…
Birth year / generations
Does public transport mode share vary by age and/or does it vary by when people were born, with different mode choices by different generations? To answer this I’m going to look at mode shares by both age and birth year.
For this analysis, I want to compare mode shares of birth year cohorts over time. The exact composition of these cohorts will change over time as there are deaths, new immigrants, and people who move overseas. I can only easily control for immigrants using census data – so for this section of my analysis I’m going to remove people not born in Australia (I will return to look at mode shares of immigrants shortly). Of course some people born in Australia who worked in Melbourne in 2016 may have spent a significant time living outside Australia before a census so this isn’t perfect.
Firstly, here’s a chart of journey to work PT mode shares by age, work location, and parenting status across 2006, 2011, and 2016 for people born in Australia:
Technical note: I’ve excluded data points where there was a small number of commuters, or a small number of public transport journeys where calculations are impacted by ABS randomisation to protect privacy.
You can see the general shape of the census year curves are similar within each quadrant (with a little noise at the extremes of age probably due to smaller volumes), suggesting a similar relationship between PT mode share and age holds over time.
We can clearly see how mode shares have increased over time for age bands, including:
those who work in the City of Melbourne (top row),
non-parenting younger adults who worked outside the City of Melbourne (bottom-left), and
to a smaller extent parents in their 30s and 40s who worked outside the City of Melbourne (bottom-right).
There were PT mode share spikes at age band 16-17 (at least for people working outside the City of Melbourne), which is just before people can gain independent licences. Those aged 18-19 working outside the City of Melbourne had a much lower PT mode share than those aged 16-17, and PT mode shares were lower again for those aged 15 who are perhaps more likely to work locally or be driven to work by parents.
So is this a general mode shift over time, or is it something intrinsic to birth years or “generations”? The next chart is similar to the previous, but the X-axis is notional birth year (approximated by census year – age at census time, which will be within a year of actual birth years).
Technical notes: For this chart I’ve calculated the 2 year birth year bandsso that the youngest birth band is for ages 15-16 in all census years.
Let’s walk through the quadrants:
Non-parenting, City of Melbourne (top-left): PT mode shares have increased over time for those born between the 1940s and mid-1980s, despite these commuters getting older (assuming the same people still work within the City of Melbourne). This suggests general mode shift to PT over time has been stronger than any mode shift away from PT due to aging.
Parenting, City of Melbourne (top-right): PT mode shares have increased over time for almost all birth years, despite getting older (although the membership of this cohort will change as people acquire and lose parenting responsibilities). This is the same as non-parenting workers in the City of Melbourne.
Non-parenting, outside City of Melbourne (bottom-left): Ignoring those aged 15-22, mode shifts are generally smaller and not all in the same direction. If there was a negative relationships between age and PT mode share, you’d expect to see a shift away from PT between 2006 and 2016 for all cohorts. But for those born between around 1975 and 1985 (younger generation X and older millennials) and those born between 1940 and 1958 (mostly Baby Boomers) there was a small shift towards PT over time, despite them getting older. However these mode shifts were in the order of only 1-2%. Those born between 1960 and 1974 (mostly Gen X) shifted away from PT over time.
Parenting, outside City of Melbourne (bottom-right): For people born between around 1955 and 1980 (baby boomers and gen X) there was a shift towards PT between census years 2011 and 2016, despite people ageing. However in this quadrant mode shares were pretty flat and low over most ages (except at the young and old extremes of the cohort).
Of course many people will move from the left column to the right column as they start families, and then perhaps back to left column when they have adult children who no longer need care, so this analysis isn’t perfect.
So are there generational effects on PT mode share? Between 2006 and 2016 there was a significant shift towards PT in Melbourne for most birth years, parenting statuses and work locations, with only non-parenting workers born between 1960 and 1974 and working outside the City of Melbourne shifting away from PT. So the answer is no – any impact from birth year appears to be very small, and was generally swamped by an overall mode shift towards public transport.
That analysis was for for people born in Australia, but what about immigrants?
Immigrants to Australia
Are people who immigrated into Australia more recently, more likely to use PT to get to work? The next chart provides a clear “yes” answer to that question. I’ve included parenting status and work location as known significant factors, and animated the chart over censuses 2006, 2011 and 2016.
While the lines appear to shift left, they are really shifting up or down (people’s birth year doesn’t change), and are growing on the left with new younger workers entering the labour market, and falling away on the right as people leave the workforce.
Time of immigration had a big impact on PT mode shares – with people who arrived in Australia in the five years before a census most likely to use PT to get to work. The biggest difference in PT mode shares was for recent non-parenting immigrants working outside the City of Melbourne (bottom-left quadrant). Perhaps if public transport quality was boosted in areas with many recent immigrants there might be less loss of mode share over time. Or the drop in mode share might reflect people moving to areas with lower quality public transport.
For those working outside the City of Melbourne, PT mode share quickly fell after arrival into Australia, and after around 20 years living in Australia immigrant’s mode shares are similar to those who have been in Australia longer (or were born in Australia).
The chart also shows that there are age-related factors at play (beyond parenting and work location), regardless of whether people were born in Australia or immigrated – although much less so if they are parenting.
So could it be that recent immigrants make up a greater share of young adults, and might this explain the overall average mode shares across age groups?
The next chart shows the distribution of working population in five-year age bands by year of immigration / those born in Australia. I’ve animated this over 2006 to 2016. While the chart appears to animate with vertical movements, people actually shift one column to the right between census years.
If you watch the chart you’ll see that the immigrant share of the working population under 45 years increased between 2006 and 2016, with strong surges in immigration after 2006. This will undoubtedly impact the overall mode share for younger adults, but it doesn’t explain all of the mode share variance by age. The previous chart showed age-related factors influencing PT mode shares, regardless of when people moved to Australia.
I will explore potential reasons why recent immigrants were more likely to use public transport to get to work in an upcoming post.
Can we now explain why young adults are more likely to use public transport?
So far we’ve established that the following factors appear to have a strong impact on public transport mode shares:
Workplace distance from the CBD
Recency of immigration to Australia
Parenting status
Age
If the first three of these factors are the most important, and age or other age-related factors were not important, then we would expect flat mode shares across ages when you control for the other three factors.
The following matrix-of-worms chart combines all four factors. But please note that the Y axis within each row has a different scale and doesn’t necessarily start at zero. I am really looking at the slope of the line within each matrix cell, so I’m not too concerned about the actual values. I’ve only shown data points that included at least 400 commuters, and I’ve removed some columns and rows where data was too sparse to show meaningful trends.
How to make sense of this chart? Well, if the factors of parenting, arrival year and work distance from the CBD explained all the differences between age groups, then you would expect these lines to be flat within each matrix cell.
On the parenting (right) side of the chart, many of the worm lines are indeed quite flat, with the exception of those who arrived between 2006 and 2015 and those who worked within 2 km of the Melbourne CBD. Even though many of these matrix cells only have two or three data points, most data points include thousands of commuters so I don’t expect much false “noise” in the chart.
Within non-parenting commuters:
There is generally either a relationship with age, or a very low and flat PT mode share across ages, suggesting age itself, or some other age-related factors were at play.
The relationship with age appears to be strongest for more recent immigrants. The Born in Australia column also shows a strong relationship with age but this also has the widest age range. The columns for those who arrived between 1976 and 1995 only contain 3 to 5 age bands (all 30+), which will partly explain why there is less of an evident slope in the line.
Age band 60-69 is often an outlier to the trend, particularly for those born in Australia or who arrived between 1976 and 1985, again perhaps related to discounted “Seniors” public transport fares.
So I haven’t been able to fully explain variations in PT use by age. Age itself may be a factor, there may be other age-relevant factors that are important, or more likely there are lots of complex interactions between factors that are hard to unpick.
The next post in this series will look at the impact of income, socio-economic advantage/disadvantage, and occupation on PT mode shares across ages.
I’ve recently been analysing how public transport mode share varies with age and associated demographic factors. In part 3 of that series, I found that immigrants – and particularly recent immigrants – were much more likely to use public transport (PT) in their journey to work. This post explores why that might be, using data for Melbourne from the ABS Census (mostly 2016).
About immigrant data
The census covers both temporary and permanent residents. I’ve counted all people who were born overseas and came to Australia intending to stay for at least one year as “immigrants”, regardless of whether they were temporary or permanent residents.
It’s worth looking at the number of immigrants living in Greater Melbourne by age and arrival year, as at 2016:
Except for the first and last columns, each column represents 10 arrival years. You can see a significantly larger population of immigrants who arrived between 2006 and 2015, and they skewed significantly to ages 20-39. We know from previous analysis that younger adults are more likely to use public transport, so age is likely to play a role.
But how many immigrants are temporary residents? The census doesn’t include a question about permanent residency, but it is possible to track arrival year range cohorts over time.
The following chart tracks the number of immigrants for arrival year ranges between the 2006, 2011 and 2016 censuses (using Significant Urban Area geography).
If there were a significant number of temporary residents (although still intending to stay at least one year), then you’d see a large drop in the population of people who arrived 1996 to 2005 over time between 2006 and 2011/2016. There certainly was a drop off, but it was a small proportion.
This suggests most migrants end up being long-term residents (including many who enter on temporary visas but then gain permanent residency).
Numbers in all arrival year ranges dropped slowly over time through people leaving Melbourne (and possibly Australia) and deaths (particularly for immigrants from earlier years many of whom would be in their senior years).
Immigrants and public transport mode share of journeys work
To recap my previous analysis, the relationship between immigration year and PT mode share has held for the last three censuses (2006, 2011, and 2016), regardless of parenting status, birth year, or whether the someone worked inside or outside the City of Melbourne (local government area):
So why might recent immigrants be more likely to use public transport? From looking at the data, I think there are several plausible explanations.
To start with, they were more likely to work in the City of Melbourne, and we know journeys to work in the City of Melbourne have much higher public transport mode shares:
They were also more likely to live in areas with lower levels of motor vehicle ownership. Each column in the following chart represents the population of immigrants for a range of arrival years, and that population is coloured based on the motor vehicle ownership rate of all residents in the (SA1) areas in which they live (including non-immigrants). Note: immigrants themselves may have had different rates of motor vehicle ownership to the average of people in the areas in which they lived.
As I’ve mentioned previously, I do not have access to data to calculate the ratio of household motor vehicles to driving-aged adults within immigrant households, but I can calculate the ratio of household vehicles to all household residents (not all of whom may be of driving age).
The following chart shows that more recent immigrants were likely to have much lower levels of motor vehicle ownership that those who have been living in Australia longer.
Aside: Immigrants who arrived in Australia 1900-1945 had much higher rates of motor vehicle ownership than people born in Australia, but they were also all aged over 70 in 2016.
BUT if you look at PT mode shares for each vehicle : person ratio, there is still a relationship with year of arrival (see next chart), so car ownership doesn’t fully explain why recent immigrants were more likely to use public transport.
Looking at other factors, recent immigrants were slightly more likely to live closer to the city centre:
And they were more likely to live near a train station:
However not all recent immigrants to Melbourne lived near the city or a train station. Here’s a map showing the density of persons who arrived in Australia between 2006 and 2016 as at the August 2016 census.
There were significant concentrations in outer growth areas such Point Cook, Tarneit, and Craigieburn. These suburbs also happen to have very well patronised rail feeder bus routes, and unusually higher concentrations of central city commuters for their distance from the CBD.
Recent immigrants were more likely to live in areas of higher residential density:
And they were more likely to work near the city centre:
More-recent immigrants were also more likely to have a higher level of educational attainment than less-recent immigrants, and generally much higher than those born in Australia:
This probably reflects skilled immigration programs favouring people with higher educational qualifications. Indeed 60% of workers who arrived between January 2016 and the August 2016 census had a Bachelor or higher qualification. And we know from a previous post that highly qualified workers were more likely to work in central Melbourne, and were more likely to have used public transport in their journey to work.
Not only were more recent immigrants generally highly educated, many came to Melbourne to study to raise their educational attainment. Here is a chart showing the proportion of immigrants who were full-time or part-time students, by arrival year groups:
I will explore the relationship between student status and journey to work mode shares in an upcoming post.
How did immigrants shift around Melbourne over time?
Could internal migration explain why immigrants shifted away from public transport over time? Using census data across 2006, 2011, and 2016, it is possible to roughly track the population distribution of particular immigrant cohorts (although it’s not perfect because these immigrants may have moved in/out of Melbourne or left Australia between censuses, including temporary residents).
The following map shows the density of immigrants who arrived in Australia between 1996 and 2005 across census years 2006, 2011, and 2016:
In 2006 there were concentrations around the central city and many rail stations. But these concentrations reduced over time, with many of these people moving into other suburbs by 2011 or 2016 (or leaving Melbourne). In particular, many moved to outer suburbs such as Tarneit, Truganina, Point Cook, Derrimut, Craigieburn, Roxburgh Park, and Narre Warren South.
To help summarise these shifts, the following chart shows the distribution of this cohort across census years by distance from train stations, distance from the Melbourne CBD, and the motor vehicle ownership rate of the areas in which they lived:
You can see that they generally moved further away from train stations, further away from the CBD, and into areas that had higher levels of motor vehicle ownership. All these shifts are associated with reduced public transport mode share, and I suspect this pattern would not be unique to those who arrived 1996-2005.
Is there a relationship between PT mode shares and where people were born?
Firstly, here’s a chart showing the birth regions of Melbourne workers who were born outside Australia, by year of immigration (mostly 5 year bands). I’ve used ABS’s country of birth groups, except that I’ve separated North America from the other Americas.
The early half of the 20th century saw significant immigration from Europe, whereas in more recent times this has shifted to Asia, with southern and central Asia now the biggest source of immigrants. (Southern and central Asia includes India, Sri Lanka, Bangladesh, many former Soviet republics south of Russia and all “-stan” countries.)
So do journey to work public transport mode shares vary by immigrants’ region of birth?
There certainly is some variance between birth regions, but not quite what I was expecting. Immigrants from seemingly car-dominated north America had much higher PT mode shares than those born in European countries with reputations for higher quality public transport.
Of course people born in different parts of the world may be more or less likely to work in the City of Melbourne, and might be more or less likely to be parents. These factors strongly influence PT mode shares. So the next chart disaggregates the data by parenting status and work location (note a different X-axis scale used for each work location division).
This birth regions in this chart have the same ordering as the previous chart, but in most quadrants the mode shares are no longer in order (the top-right quadrant being the exception: non-parenting, working outside the City of Melbourne). Southern and central Asia tops PT mode shares for the other three quadrants, and by quite a large margin for City of Melbourne workers.
We know year of arrival into Australia is a significant factor in PT mode shares, and relative composition of immigrants has certainly changed over time. Also, age itself is likely to be a factor. The next chart adds these two dimensions. However, I have had to remove people working in the City of Melbourne, those under 20 and those over 60 – because the population for these categories became too small, introducing meaningless noise.
You can see there was a relationship between year of arrival and PT mode share within each age band, for both parenting and non-parenting workers. Central and Southern America generated the highest average PT mode shares while North Africa and the Middle East often had the lowest PT mode shares.
Here’s another look at that data, but comparing mode shares primarily by age rather than year of arrival. For this chart I’ve (also) removed parenting workers, and those who arrived before 1982, because they are mostly spread across just two 10 year age bands which isn’t really enough to show an age-based trend:
This chart shows that there was certainly a relationship between age and PT mode share for most birth regions (as well as year of arrival), at least for non-parents working outside the City of Melbourne.
I cannot be certain that this pattern also existed for all birth-regions for parenting workers and people who worked within the City of Melbourne, but I have previously shown a relationship between age and PT mode share for these categories (when ignoring birth region), so a relationship is likely.
So even with a changing mix of immigrant sources over time, age (or some other age-related factor) remains a significant factor when it comes to explaining public transport mode shares.
I hope you’ve found this at least half as interesting as I did.
Each year, just before Christmas, the good folks at the Australian Bureau of Infrastructure, Transport, and Regional Economics (BITRE) publish a mountain of data in their Australian Infrastructure Statistics Yearbook. This post aims to turn those numbers (and some other data sources) into useful knowledge – with a focus on vehicle kilometres travelled, passenger kilometres travelled, mode shares, car ownership, driver’s licence ownership, greenhouse gas emissions, and transport costs.
Of course the world of transport changed significantly in 2020, with suppressed movement from around mid March, as the COVID19 pandemic led to movement restrictions across Australia. Most of the following data is for financial years, so you will see some impacts where data is available for financial year 2019-20.
Vehicle kilometres travelled
Total vehicle kilometres travelled has been increasing most years, until 2019-20, when it fell from 264 to 247 billion kilometres.
Here’s the growth by vehicle type since 1971:
Light commercial vehicle kilometres have grown the fastest, curiously followed by buses (although much of that growth was in the 1980s). In 2019-2020, there were noticeable reductions for most vehicle types, except trucks.
Car kilometre growth has slowed significantly since 2004, and actually peaked in 2016-17 according to BITRE estimates.
On a per capita basis car use peaked in 2004, with a general decline since then. Here’s the Australian trend (in grey) as well as city level estimates until 2015 (from BITRE Information Sheet 74):
Technical note: “Australia” lines in these charts represent data points for the entire country (including areas outside capital cities).
Darwin has the lowest average which might reflect the small size of the city. The blip in 1975 is related to a significant population exodus after Cyclone Tracey caused significant destruction in late 1974 (the vehicle km estimate might be on the high side).
Canberra, the most car dependent capital city, has had the highest average car kilometres per person (but it might also reflect kilometres driven by people from across the NSW border in Queanbeyan).
The Australia-wide average is higher than most cities, with areas outside capital cities probably involving longer average car journeys and certainly a higher car mode share. There was a sharp drop in vehicle kms per capita in 2019-20, almost certainly due to COVID-19.
Passenger kilometres travelled
While BITRE’s passenger km estimates were available up to 2019-20 at the time of writing, city population estimates were only available up until June 2019. So in this section, per capita data stops at 2018-19 (before COVID-19), while total km charts go to 2019-20.
Here are passenger kilometres per capita for various modes for Australia as a whole (note the log-scale on the Y axis). Unfortunately BITRE have not published national estimates beyond 2017-18 in their 2020 Yearbook.
Air travel took off (pardon the pun) in the late 1980s (although with a lull in 1990 due to the pilot’s strike), car travel peaked in 2004, bus travel peaked in 1990 and has been relatively flat since, while rail has been increasing in recent years.
Car passengers
Here’s a chart showing total car passenger kms in each city:
The data shows that Melbourne overtook Sydney in 2016-17 as having the most car passenger travel, but then cities were even again in 2019-20 with COVID19 impacts.
Another interesting observation is that total car passenger travel declined in Adelaide in 2018-19 (pre-COVID) according to (revised) BITRE estimates.
However there are large differences in population growth rates between cities. So here is the data per capita:
While car passenger kilometres per capita peaked in 2004 in all cities, there were some increases from around 2013 to 2018 in some cities, but most cities declined in 2019 and 2020 (the latter being no doubt partly related to COVID-19). Darwin is an outlier with an increase in car passenger kms per capita between 2015 and 2020.
Rail passengers
Here are rail passenger kms per capita to 2018-19:
Sydney had the highest train use of all cities and this has been taking off in recent years, likely due to service level upgrades. Other cities have been flat or were in decline (such as Melbourne).
You can see two big jumps in Perth following the opening of the Joondalup line in 1992 and the Mandurah line in 2007. Melbourne, Brisbane and Perth have shown declines over recent years.
Here is growth in total rail passenger kms since 2010 (NOT per capita):
Sydney trains saw rapid growth in the years up until 2019, again probably reflecting significant service level upgrades to provide more stations with “turn up and go” frequencies at more times of the week.
Adelaide’s rail patronage dipped in 2012, but then rebounded following completion of the first round of electrification in 2014.
All cities saw significant declines in 2019-20 with COVID-19 impacts, although BITRE caveats that the 2019-20 estimates for public transport modes were “rough” at the time of publication.
Bus passengers
Here’s bus passenger kms per capita up to 2018/19:
Bus passenger kms per capita have been declining in most cities in recent years, with the exception of Sydney.
Significant investments in bus services in Melbourne and Brisbane between around 2005 and 2012 led to significant patronage growth.
Melbourne has the lowest bus use of all the cities, but this likely reflects the extensive train and tram networks carrying the bulk of the public transport passenger task. Melbourne is different to every other Australian city in that trams provide most of the on-road public transport access to the CBD (with buses performing most of this function in other cities).
Darwin saw a massive increase in bus use in 2014 thanks to a new nearby LNG project running staff services.
Australia-wide bus usage is surprisingly high. While public transport bus service levels and patronage would certainly be on average low outside capital cities, buses do play a large role in carrying children to school – particularly over longer distances in rural areas. The peak for bus usage in 1990 may be related to deregulation of domestic aviation, which reduced air fares by around 20%.
Here is growth relative to 2010:
All cities saw a substantial reduction in 2019-20 due to COVID-19, with Hobart having the smallest reduction. Perhaps there is less discretionary and office-commuter travel on Hobart’s buses?
Light rail passengers
Light rail passenger kms per capita is not really meaningful as Melbourne has a large network, while Sydney and Adelaide have very small (although growing) networks. Here is estimated passenger km growth since 2010:
Sydney light rail patronage increased following the Dulwich Hill extension that opened in 2014, and again with the new lines joining the CBD with Randwick and Kingsford opening in 2019-20. The passenger km growth would have been higher if not for COVID-19.
Adelaide patronage increased following an extension to the Adelaide Entertainment Centre in 2010, and then flatlined for several years. In October 2018, new extensions to Festival Plaza and Botanic Gardens opened but passenger kms actually declined in FY 2018-19.
Mass transport
We can sum all of the mass transport modes (I use the term “mass transport” as the numbers include both public and private bus services). Firstly. here is mass transit share of estimated total motorised passenger kilometres in each city (unfortunately there are no estimates of walking and cycling kilometres):
All cities saw a mode shift away from mass transit in 2019-20 due to COVID-19, which likely reflects the shift to working from home for CBD workers (with such commuter trips making up a substantial share of PT patronage). During the recovery after lockdowns, road traffic has returned to almost normal in most cities, whilst public transport patronage is still well down on pre-COVID19 levels. I should mention again that BITRE describe their 2019-20 estimates of non-private passenger kilometres as “rough”.
But looking at trends prior to 2019-20, Sydney was leading the country in mass transport use per capita which was also rising fast to 2019, with a 2% mode shift between 2016 and 2019 (mostly attributable to trains). The Sydney north west Metro line opened in May 2019, so would only have a small impact on these figures.
Melbourne mass transit had been losing mode share between 2012 and 2019, while other cities have been largely flat or trending down (although Brisbane, Adelaide, and Perth has a small increase in 2018-19).
Melbourne made significant gains between 2005 and 2009, and Perth grew strongly 2007 to 2013, but has since shifted away from public transport (which may be related to a decentralisation of employment).
Here is growth in mass transport passenger kms since 2010:
Darwin saw substantial growth associated with staff bus services to a new LNG plant, while Sydney otherwise was leading in mass transit passenger kilometre growth.
Here’s how car and mass transit passenger kilometres have grown since car used peaked in 2004:
Mass transit use has grown much faster than car use in Australia’s three largest cities. In Sydney and Melbourne it has exceeded population growth, while in Brisbane it is more recently tracking with population growth.
Mass transit has also outpaced car growth in Perth, Adelaide, and Hobart:
In Canberra, both car and mass transit use has grown much slower than population, and it is the only city where car growth has exceeded public transport growth.
Motorcycles
Here are motorcycle passenger kms per capita:
Motorcycle travel was declining per capita until 2000, had a resurgence between 2004 and 2009 (perhaps as fuel prices rose?) and has since reduced somewhat in most cities. I’m not quite sure what might have happened in Melbourne in 2006 to suddenly stop the growth in use. I also wonder about the precision of estimates of motorcycle passenger kilometres, given it is such a small mode.
Car ownership
The ABS conduct a Motor Vehicle Census generally once per year (although less often historically), and the following chart includes that data up until January 2020, combined with population estimates released in December 2020.
Car ownership has risen significantly over time, although this growth has slowed considerably more recently in some states.
However the above measure doesn’t take into account people not of driving age. So the following chart looks at passenger cars per persons aged 18-84 (for want of a better definition of driving aged persons):
It’s still a bit hard to see the more recent trends, so here is a chart that looks at 2000-2020, excludes the Northern Territory (zooming on the top-right section):
This data shows that car ownership peaked in Victoria in 2013, Western Australia in 2017, New South Wales in 2017, Queensland in 2018, South Australian in 2018, and Australia overall in 2018. The Australian Capital Territory may have peaked in 2019 but perhaps it is a little too early to call, while Tasmanian now has the highest car ownership in the country and is still growing strongly.
Here is a chart showing motorcycles per persons aged 18-84:
This chart shows a slightly different pattern to that of motorcycle passenger kilometres per capita in cities (above). Ownership and usage bottomed out around the 1990s or 2000s (depending on the state/city). However ownership has risen in most states since then, but usage apparently peaked around 2009 in most cities. This perhaps suggests motorcycles are now more a recreational – rather than everyday – vehicle (I really don’t follow the motorcycle industry very closely so others might better explain this).
Driver’s licence ownership
Thanks to BITRE Information Sheet 84, the BITRE Yearbook 2020, and some useful state government websites (NSW, SA, Qld), here is motor vehicle licence ownership per 100 persons (of any age) from June 1971 to June 2019 or 2020 (depending on data availability):
Technical note: the ownership rate is calculated as the sum of car, motorbike and truck licenses – including learner and probationary licences, divided by population. Some people have more than one driver’s licence so it’s likely to be an over-estimate of the proportion of the population with any licence.
There’s been slowing growth over time, but Victoria has actually seen slow decline since 2011, and the ACT peaked in 2014.
Here’s a breakdown by age bands for Australia as a whole:
Licencing rates have been increasing over time for those aged over 40 (most strongly for those aged over 70), and have been declining for those aged under 40, although there was a notable uptick in licence ownership for 16-19 year-olds in 2018.
The next chart shows licencing rates for teenagers:
Licence ownership rates for teenagers had been trending down in South Australia and Victoria until 2017, while most other states have been trending upwards in recent years. The differences between states partly reflects different minimum ages for licensing.
Here are 20-24 year olds:
The largest states of Victoria and New South Wales had seen downwards trends until 2019, while all other states and territories are trending up. The big upticks in 2020 for Queensland and NSW might be a new trend, might also be impacted by the preliminary nature of June 2020 population estimates from the ABS, and/or might be impacted be an exodus of international students.
25-29 year olds are a mixed bag – Victoria has been trending downwards sharply, New South Wales has (probably) just ended a downwards trend, while most other states have been increasing or relatively steady.
Licencing rates for people in their 70s have been rising in all states, although it may be slowing in Western Australia and NSW more recently (I have excluded 2016 for South Australia as I suspect a data error):
A similar trend is clear for people aged 80+ (Victoria was an anomaly before 2015):
For completeness, here is a chart showing motorcycle full licence ownership rates:
Queensland has two types of motorcycle licence and I suspect many people hold both, which might explain a licence ownership rate being so much higher than other states.
Transport greenhouse gas emissions
According to the latest adjusted quarterly figures, Australia’s domestic non-electric transport emissions peaked in 2018, had been slightly declining (which reflects reduced consumption of petrol and diesel) before COVID impacted the year-ending June 2020 figure.
The seasonally-adjusted estimate for the June quarter of 2020 is 19.2 Mt, which is down 24% on the June quarter of 2019:
Non-electric transport emissions made up 19.1% of Australia’s total emissions as at December 2019 (before the COVID-19 impact).
Here’s a breakdown of transport emissions by financial year:
A more detailed breakdown of road transport emissions is available, but only back to 1990:
Here’s growth in transport sector emissions since 1975:
The 2019-2020 estimates are heavily impacted by COVID-19, most evidently in aviation, but also for road transport.
Road emissions had grown steadily to 2019, while aviation emissions took off around 1991 (pardon the pun). You can see that 1990 was a lull in aviation emissions, probably due to the pilots strike around that time.
In more recent years non-electric rail emissions have grown strongly. This will include a mix of freight transport and diesel passenger rail services – the most significant of which will be V/Line in Victoria, which have grown strongly in recent years (140% scheduled service kms growth between 2005 and 2019). Adelaide’s metropolitan passenger train network has historically run on diesel, but has more recently been transitioning to electric.
Here is the growth in each sector since 1990 (including a breakdown of road emissions):
Within road transport, COVID-19 has had the biggest impact on cars, buses, motor cycles and light commercials. However, emissions from (larger) articulated trucks continued to grow.
Here are average emissions per capita for various transport modes in Australia, noting that I have used a log-scale on the Y-axis:
Per capita emissions have been decreasing for cars, and – until 2019 – were relatively stable for most other modes. Total road transport emissions per capita peaked in 2004 (along with vehicle kms per capita, as above).
Transport greenhouse gas emissions intensity
It’s possible to combine data sets to estimate average emissions per vehicle kilometre for different vehicle types, but only until 2018 with published data (note I have again used a log-scale on the Y-axis):
Note: I suspect the kinks for buses and trucks in 2015 are issues to do with estimation assumptions made by BITRE, rather than actual changes.
Most modes have shown slight declines in emissions per vehicle km, except trucks. On these estimates, car have dropped from 281 g/km in 1990 to 243 g/km in 2018.
However, the above figures don’t take into account the average passenger occupancy of vehicles. To get around that we can calculate average emissions per passenger kilometre for the passenger-orientated modes (data only available until 2018 unfortunately):
Domestic aviation estimates go back to 1975, and you can see a dramatic decline between then and around 2004 – followed little change (even a rise in recent years). However I should mention that some of the domestic aviation emissions will be freight related, so the per passenger estimates might be a little high.
Car emissions per passenger km in 2017-18 were 154.5g/pkm, while bus was 79.0g/pkm and aviation 127.2g/pkm.
Of course the emissions per passenger kilometres of a bus or plane will depend on occupancy – a full aeroplane or bus will have likely have significantly lower emissions per passenger km. Indeed, the BITRE figures imply an average bus occupancy of around 9 people (typical bus capacity is around 70) – so a well loaded bus should have much lower emissions per passenger km. The operating environment (city v country) might also impact car and bus emissions. On the aviation side, BITRE report a domestic aviation average load factor of 79.3% in 2019-20.
Cost of transport
The final topic for this post is the real cost of transport. Here are headline real costs (relative to CPI) for Australia:
Technical note: Private motoring is a combination of factors, including motor vehicle retail prices and automotive fuel. Urban transport fares include public transport as well as taxi/ride-share.
The cost of private motoring has tracked relatively close to CPI, although it seems to be trending down since 2008, probably largely related to reductions in the price of automotive fuel (which peaked in 2008). The real cost of motor vehicles has plummeted since 1996, although that trend may have stopped in 2018. Urban transport fares have been increasing faster than CPI since the late 1970s, although they have grown slower than CPI (on aggregate) since 2013.
Here’s a breakdown of the real cost of private motoring and urban transport fares by city (note different Y-axis scales):
Note: I suspect there is some issue with the urban transport fares figure for Canberra in June 2019. The index values for March, June, and September 2019 were 116.3, 102.0, and 118.4 respectively.
Urban transport fares have grown the most in Brisbane, Perth and Canberra – relative to 1973.
However if you choose a different base year you get a different chart:
What’s most relevant is the relative change between years – eg. you can see Brisbane’s experiment with high urban transport fare growth between 2009 and 2017 in both charts.
Motor vehicle ownership has a strong relationship with private transport mode share, and has recently seen declines in some Australian cities (e.g. Melbourne). In addition, we know that younger adults more recently have been deferring the acquisition of a driver’s licence (see: Update on Australian transport trends (December 2020)), so have they also been deferring motor vehicle ownership? For which age ranges has motor vehicle ownership increased and decreased? How might this have influenced journey to work mode shares? And how do changes in motor vehicle ownership relate to changes in driver’s licence ownership?
This post aims to answer those questions for Australia’s six largest cities, primarily using 2011 and 2016 census data, but also using household travel survey data for Melbourne.
But first…
A quick update on motor vehicle ownership trends in Australia
As I was writing this post, ABS released data for their Census of Motor Vehicle use – January 2021 (sadly the last motor vehicle census run by the ABS). I’ve matched this up with the latest available population data, and found a small but significant uptick in motor vehicle ownership rates in all Australian states in 2021 following the onset of the COVID-19 pandemic:
It could also reflect a mode shift from public to private transport, as people seek to avoid the perceived risk of COVID-19 infection on public transport.
But there’s another likely explanation of this uptick and it relates to ages, so keep reading.
What does household travel survey data tell us about motor vehicle ownership by age in Melbourne?
My preferred measure is the ratio of household motor vehicles to adults of driving age (notionally 18 to 84).
Using Melbourne household travel survey data (VISTA), I can calculate the average ratio by age group pretty easily, and the following chart also breaks this down for parents, children, and other people (living in households without parent-children relationships):
With 2-year age bands there is a limited span of age ranges for some categories due to the small survey sample sizes (I’m only showing data points with 400+ people). So here is a similar chart using 4-year age bands, which washes out some detail but provides values for wider age ranges:
You can see some pretty clear patterns. Motor vehicle ownership was high for households with children (peaking for ages 12-13), parents – particularly in their late 40s, and those aged in their 50s and early 60s in households without children. Average motor vehicle ownership was lowest for young adults living away from their parents, and for those in older age groups.
Unfortunately the VISTA dataset isn’t really big enough to enable significant analysis of changes over time – the sample sizes for age bands get too thin when you split the data over years or even groups of years. I’d like to understand changes over time, so…
What can census data tell us about motor vehicle ownership by age?
Unfortunately it’s not possible to calculate the ratio of household motor vehicles to adults using Census (of Housing and Population) data (at least when using ABS Census TableBuilder).
The numerator is pretty easy for the 2011 and 2016 censuses which classify private dwellings as having zero, 1, 2, 3, 4, …, 28, 29, or “30 or more” motor vehicles. Only a very small number of households report 30+ motor vehicles. Unfortunately the 2006 census’s top reporting category is “4 or more” motor vehicles which means you cannot calculate the motor vehicle ratio for many households.
My preferred denominator – the number of adults of driving age – is not available in ABS’s Census TableBuilder. The closest I can get is the “number of persons usually resident” for dwellings – and private dwelling are classified as having 1, 2, 3, 4, 4, 5, 6, 7, or “8 or more” usual residents in the 2006, 2011 and 20216 censuses. Obviously I cannot calculate the ratio of motor vehicles to usual residents if there were “8 or more” usual residents.
(For the census data nerds out there: I tried to get a good guess of adults by using family composition, but it can only distinguish parents (who may or may not be of driving age), children under 15, and dependent students aged 15-24. And worse still, that doesn’t work for multi-family households, and you cannot filter for single family households as well as distinguish family types.)
So I’m stuck with household motor vehicles per person usually resident. And an obvious drawback is that motor vehicle ownership will be lower for adults living in households with children, compared to those without children.
Here’s the distribution of motor vehicle : household size ratios for Greater Melbourne for 2011 and 2016 (I’ve left out 2006 because too many households cannot be calculated). There are a lot of different ratio values, but only about a dozen common ratios, several of which I have labelled on the chart.
Sure enough, there were much lower ownership ratios for children’s households, and adult ages where children were more likely to be resident (generally mid-20s to around 60). Higher ratios peaked for people in their early 60s and then steadily declined into older ages, with most people in their 90s living in dwellings with no motor vehicles (if they are not living in non-private dwellings). For adults in their 60s, one car per person was the most common ratio.
I can also calculate the average motor vehicle ownership ratio for each age as an aggregate statistic (excluding 3-4% of households where I don’t know the precise number of residents and motor vehicles). Here’s how that looks for 2011 and 2016:
As mentioned, I cannot calculate this ratio for households where I don’t know the precise number of both motor vehicles and usual residents (or where I don’t know the number of usual residents, but do know there were zero motor vehicles). Across Australia’s five biggest cities that’s 4.1% of population in the 2016 census, 3.4% in 2011, and 10.4% in 2006 (but much higher proportions of younger adults). They sound like small numbers, but aren’t that small when you consider the shifts in ownership between censuses.
But there is another way to classify households with fewer unknowns – whether they have:
no motor vehicles;
fewer usual residents than motor vehicles; or
at least one motor vehicle per usual resident.
The benefit of this approach is that you can classify almost half of the households where you cannot calculate an exact ratio:
If a household had 30+ motor vehicles (very rare) but fewer than 8 usual residents, then it had at least one vehicle per person.
If a household had 4+ motor vehicles (quite common in 2006 census) and 4 or fewer usual residents, then it had at least one vehicle per person.
If a household had 8+ usual residents (about 1.3% of population in 2016), but 7 or fewer motor vehicles (93.5% of the 1.3%), then it had less than one vehicle per person.
Across Australia’s biggest five cities I can now classify all but 2.5% of the 2016 population, 2.3% of the 2011 population and 6.1% of the 2006 population.
The next chart shows the distribution of this categorisation for Melbourne (using Melbourne Statistic Division for 2006, and “Greater Melbourne” for 2011 and 2016). I’ve put the remaining people living in uncategorisable households (“unknown”) in between 0 and <1 motor vehicles per person, as it is likely households who did not answer the question about household motor vehicles probably had few or no motor vehicles (refer to the appendix at the end of this post for more discussion).
I have also removed people who did not provide an answer to the usual residents question (hoping they are not overly biased – they are probably households who didn’t respond to the census), and non-private dwellings (where motor vehicle ownership is not recorded).
The patterns are similar to the previous chart, with a double hump pattern of 1+ motor vehicles per person. There are some changes over time, which I’ll discuss shortly.
Unfortunately the unknown band is still pretty wide in 2006 – in fact I still cannot categorise around 15% of 20 year olds in 2006 (many must have lived in households with 4+ motor vehicles), so it doesn’t really support good time series evaluation between 2006 and 2011.
So how has motor vehicle ownership by age changed over time in Melbourne?
Many of the previous charts were animated over 2-3 censuses but there’s a lot of take in with different lines moving in different directions for different age groups. To help to get better sense of those changes, what follows are a set a static charts, and then some discussion summarising the patterns.
Firstly, the change in average motor vehicles per usual resident for each age year (but only for households where the exact number of motor vehicles and usual residents is known):
Secondly, here’s a static chart that shows the proportion of population living in households known to have 1+ motor vehicles per person for both 2011 and 2016 for Melbourne, and the difference between 2011 and 2016 (I’ve excluded 2006 as there were too more unknowns). I haven’t removed uncategorisable households from the calculations, on the assumption they bias towards lower motor vehicle ownership (as discussed above).
This chart shows very little change for children under 18, but also very few such households had 1+ motor vehicle per occupant in 2011 or 2016 so it’s not a very useful metric. Lower ownership ratios are much more common for households with children, so here’s a chart showing the proportion of the population living in dwellings with at least 0.5 motor vehicles per person, and the change between 2011 and 2016: (I used equivalent rules to classify households with 8+ usual residents or 30+ motor vehicles, where possible)
And finally, here’s a chart showing the proportion of the population living in dwellings reported to have no motor vehicles (probably an underestimate as I think many “not stated” responses are likely to be zero motor vehicles).
Each of these charts paints a similar picture. Here’s a summary by age ranges:
Age range
Motor vehicle ownership trend
0-17
Slight increase
18-26
Certainly a decline, including around 1-2% more people living in dwellings with no motor vehicles.
27-45
Small decline of around 2-3% living in households with 1+ or 0.5+ motor vehicles per person. But there was no significant increase in households with no motor vehicles, and average motor vehicles per person was relatively stable.
46-64
Very small decline (around 1%) of people living in households with 1+ and 0.5+ motor vehicles per person, but little change in households without motor vehicles.
65+
Significant increase in metrics of motor vehicle ownership, and a significant decline in dwellings without any motor vehicles.
So while overall motor vehicle ownership in Melbourne declined between 2011 and 2016, it was mostly in working aged adults, partly offset by family households and older adults increasing their rates of motor vehicle ownership.
And going back to the uptick in motor vehicle ownership in January 2021… recent immigrants to Australia have skewed towards young adults (particularly through skilled migrant visas). The massive reductions in immigrants in 2021 will mean the population contains proportionately fewer young adults – who generally have low car ownership, particularly recent immigrants. This slightly but significantly smaller number of young adults will no longer be fully offsetting those over 70 who are increasingly retaining motor vehicles longer into their life.
What about other Australian cities?
As above, I’ll present a series of charts showing the various metrics then summarise the trends.
Firstly, a chart showing the average ratio of motor vehicles per resident by age for all cities between 2011 and 2016 – for private dwellings where the exact number of vehicles and usual occupants is known:
To help see those changes, here is a static chart showing the change in average motor vehicles per person by age (I’ve used three-year age bands as the data otherwise gets a bit too noisy):
Here’s an animated chart showing the percentage of people living in private dwellings with 1+ motor vehicle per person:
There’s a lot going on in that animation (and the data gets a bit noisy for Canberra due to the relatively small population), so next is a chart showing the difference in population living with 1+ motor vehicles per usual resident:
As before, the threshold of 1 motor vehicle per person is not useful for examining the households of children, so here’s a similar change chart for the 0.5 motor vehicles per person threshold:
These difference charts mostly form duck-shaped curves with a slight increases for children, a mixture of increases and decreases for working aged adults, and a large increase for older adults (particularly for those in their 70s).
For young adults (18-30), motor vehicle ownership mostly declined in Melbourne and Canberra, but for Perth and Adelaide there was a large increase in ownership for those aged 21-39.
There was less change in ownership for those aged 40-54. On the metrics of proportion of population with 1+ and 0.5+ motor vehicles per resident there was a small decline in all cities, but for average motor vehicles per person, some cities declined and some increased. So perhaps the amount of variation in motor vehicle ownership narrowed in this age range.
Melbourne was mostly at the bottom of the pack, with Brisbane, Adelaide or Perth mostly on top.
To continue this analysis, I want to know whether these changes in motor vehicle ownership might be impacted mode share, but first we need to look at…
How did journey to work mode shares change by age?
Here are public transport mode shares of journeys to work by age for Australia’s six biggest cities, 2006 to 2016:
Public transport mode shares were much higher for younger adults in all cities in all censuses. Most cities rose between 2006 and 2011, but then different cities went in different directions between 2011 and 2016.
Here’s the mode shift between 2006 and 2011:
Most cities and ages had a mode shift towards public transport, particularly for those aged around 30, but less so for young adults.
Here’s the mode shift between 2011 and 2016:
Between 2011 and 2016 there was a mode shift to public transport in most cities for people in their 30s and 40s, but for younger adults there was a decline in public transport mode share in most cities, with only Sydney, Melbourne, and Canberra seeing growth.
However we are talking about motor vehicle ownership, and declining motor vehicle ownership may be because of mode shifts to walking, cycling, and/or public transport. So it is worth also looking at private transport mode shares (journeys involving private motorised modes but not public transport modes).
To help see the differences, here is the mode shift for private transport 2006 to 2011:
There’s a similar curve for all cities, but different cities are higher or lower on the chart. There was a shift towards private transport for young workers, a shift away in most cities for those in their 20s and 30s, and smaller shifts for those in their 40s and 50s
And from 2011 to 2016:
Again similar curves across the cities, with younger adults again more likely to shift towards private transport in most cities, a big shift away from private transport for those in their 30s and early 40s in Sydney and Melbourne, and smaller shifts for those in their 50s and 60s.
What’s really interesting here is that the mode share and mode shift curves are similar shapes across most cities (except the much smaller city of Canberra). There are some age-related patterns of travel behaviour change consistent across Australia’s five biggest cities.
How did changes in motor vehicle ownership compare to changes in private transport mode share?
If motor vehicle ownership increases you might expect an increase in private transport mode shares, and likewise you might expect a decrease in ownership to relate to a decline in private transport mode shares.
Indeed when you look at cities as a whole, there is generally a strong relationship between these measures, although different cities moved in different directions between 2011 and 2016.
In this post I’m interested in shifts for people in different age groups. The following chart shows the changes in motor vehicle ownership and private transport mode shares for each city and age group: (note different axis scales are used in each row of charts)
However I’m particularly interested in the change in these factors, rather than where they landed in each of 2011 and 2016. So the following chart plots the change in motor vehicles per 100 persons and the change in private transport mode share of journeys to work between 2011 and 2016 for five-year age bands (noting that of course every living person got five years older between the censuses).
That’s a busy chart but let me take you though it.
There’s one mostly empty quadrant on this chart (top-left): for no city / age band combinations did motor vehicle ownership decline but private transport mode share increase, which isn’t really surprising.
But in city / age band combinations where motor vehicle ownership did increase there there wasn’t always an increase in private transport mode shares – quite often there was actually a decline. So increasing motor vehicle ownership doesn’t necessarily translate into higher private transport mode shares – for journeys to work at least. Perhaps increasing affordability of motor vehicles means more people own them, but don’t necessarily switch to using them to get to work.
The largest declines in private transport mode share occurred in city/age band combinations that actually saw a slight increase in motor vehicle ownership.
The cloud is quite spread out – which to me suggests that motor vehicle ownership is probably not a major explanation for changes in mode share between 2011 and 2016 – there must be many other factors at play to explain changes in mode shares across cities. Indeed, see my post What might explain journey to work mode shifts in Australia’s largest cities? (2006-2016) for more discussion on these likely factors.
What is the relationship between motor vehicle ownership and driver’s licence ownership?
I’d prefer not to be using state level data as city and country areas might wash each other out, but I’d don’t have a lot of choice because of data availability. (Licencing data is available at postcode resolution in New South Wales (see How and why does driver’s licence ownership vary across Sydney?), but unfortunately you cannot disaggregate by both geography and age.)
Here’s another (busy) chart showing the relationship between licence and motor vehicle ownership by age band and city, across 2011 and 2016:
The main thing to take away here is that most of the points are within a diagonal cloud from bottom-left to top-right – as you might expect: there is less value having a driver’s licence if you don’t own a car, and little point owning a car if you don’t have a licence to drive it. The exceptions to the diagonal cloud are mostly age bands 30-39 and 40-49, where the average motor vehicle ownership rates are lower because many of these people often have children in their households, and I cannot remove children from the calculation using census data.
But I can control for the issue of children by going back to city geography by using household travel survey data for Melbourne (VISTA, 2012-2018). The following chart shows the relationship between average motor vehicle and driver’s licence ownership for adults by different age brackets.
The data points again generally form a diagonal cloud as you’d expect. Higher motor vehicle ownership generally correlates with higher licence ownership.
The change in ownership rates by age are interesting. Children under 10, on average, lived in households where adults have very high levels of motor vehicle and licence ownership. Licence ownership was slightly lower for adults in households with children aged 10-17 (although this could just be “noise” from the survey sample). Young adults (18-22) then on average lived in households with relatively low motor vehicle and licence ownership. As you move into older age brackets licence ownership increased, followed by increases in motor vehicle ownership, with both peaking again around ages 40-69 (although not as high as households with children). Those aged 70-79 and 80+ then had significantly lower rates of licence and vehicle ownership, as you might expect as people age and become less able to drive. These patterns are fairly consistent with the census data scatter plot, except for the key parenting age bands of 30-39 and 40-49 where the census data analysis cannot calculate ownership per adult (just per person).
How has licence and motor vehicle ownership been changing for different age groups?
Across Australia, licence ownership has been increasing in recent years for older adults (particularly those over 70), and declining in those aged under 30 in states such as Victoria, New South Wales and Tasmania (for more detail see Update on Australian transport trends (December 2020)).
The following chart shows state-level changes in motor vehicle ownership and licence ownership between 2011 and 2016 by age bands: (note different scales on each axis)
This chart also shows something of a direct relationship between changes in motor vehicle and licence ownership, with people aged 70+ having the largest increases in both measures (except for Victorians aged 80+ who saw a decline in licence ownership). Younger age bands often had a decline in licence ownership, even if motor vehicle ownership in their households increased slightly (on average). For those aged in their 40s, there was generally an increase in licence ownership but only small changes in motor vehicle ownership – including slight declines in most states.
Teenagers in the ACT were an outlier, where there was a significant decline in licence ownership between 2011 and 2016 that someone with local knowledge might be able to explain.
Overall the relationship between changes licence ownership and changes in motor vehicle ownership is not super strong. Increasing licence ownership does not automatically translate into increasing motor vehicle ownership. There must be more factors at play.
I hope you’ve found this post interesting.
Appendix: What about households where census data is missing?
The non-response rate to the question about household motor vehicles was around 8.4% in 2016 (up from 6.5% in 2011) and most of these were for people who did not respond to the census at all. Non-response was fairly consistent across age groups as the next chart shows. Quite a few people had a response to the question about number of usual occupants, but did not respond to the question about motor vehicles. Poking around census data, these people often:
didn’t answer other questions;
were less likely to be in the labour force;
were generally on lower incomes;
were more likely to be renting;
were less likely to have a mortgage; and
were more likely to live in a flat, apartment or unit, and less likely to live in a standalone/separate house.
So my guess is that they were less likely to have high motor vehicle ownership.
The number of “not applicable” responses increased significantly into older age groups, and I expect most of these will be people in non-private dwellings (e.g. aged care). I have removed people with “not applicable” responses for usual occupants and household motor vehicles as they are likely to be non-private dwellings.
The chart gets a bit noisy for ages above 100 as very few such people live in private dwellings.
Can we learn anything from pre-pandemic working-at-home patterns that will help us predict transport demand “after” the pandemic?
This post investigates work-at-home patterns from the ABS census 2016 for the six largest Australian cities, with some deeper dives for Melbourne and Sydney. I’ll answer questions such as: What occupations and industries were more likely to work-at-home? How did work-at-home rates vary by home and work locations? How many people had their home double as their workplace? Who was ‘remote working’ at home away from their regular workplace?
I’ve found the results quite interesting – and not quite what you might expect from the our current pandemic perspective.
What proportion of workers worked at home in 2016?
The following table shows between 3.3% and 5.2% of major city workers reported that they “worked at home” on census day in 2016 in Australia’s six largest cities:
This highest rate was in Brisbane, and the lowest in Canberra.
What occupations were more likely to work at home in 2016?
Here’s a chart showing 2016 journey to work mode shares across Australia’s six largest cities by main occupation category. Normally I exclude people working at home from mode share charts, but for this analysis I’m including “worked at home” as a “mode”:
Technical note: As usual on my blog, public includes all journeys involving a bus, tram, train and/or ferry trip, Active includes walk-only and cycle-only journeys, with all other journeys counted as Private.
You’ll notice the occupations with the highest rates of working at home were also the occupations with the highest public transport mode shares – professionals, clerical and administrative workers, and managers.
Here’s another view of that data, this time providing the occupation breakdown of commuters for each “mode”:
Again you can clearly see the same three occupation categories that dominated both working at home and public transport commuting.
No surprises there, right? These occupations generally spend a lot of time in offices either at computers or meeting with others – which can more easily be done online so are more likely to be amenable to working from home. The other occupation categories are more likely to necessitate working at a specific workplace.
But there are lots of different types of managers and professionals and they work in many different industries, so let’s dig a little deeper.
How did working at home vary by employment industry?
Here’s a look at the worked-at-home rates in 2016 by industry and occupation (highest level categories). I’ve sorted the occupations and industries such that the highest rates of worked-at-home are towards to the left and top of the table respectively.
The highest rates of working at home were found in Agriculture, Forestry and Fishing, Arts and Recreational Services, and Construction. Not exactly the sorts of jobs you would expect to fill multiple CBD office towers.
It’s also worth looking at the second level of occupation classifications:
Now we start to see working at home rates are very high for farm managers and arts and media professionals. For many of these people their workplace is quite likely to also be their home.
Many occupations that you might expect to be generally office-based had a working at home rate of around 9% – including HR, marketing, ICT, design, engineering, science and transport professionals.
How did working at home vary by home location?
Here’s a map showing working at home rates for SA2s across Greater Melbourne:
Working at home rates were highest in peri-urban areas, higher than the average in more advantaged suburbs of Melbourne, and the lowest rates of working at home were for employees from more disadvantaged areas.
Here’s the same for Sydney:
The highest rates were also seen in peri-urban areas of Greater Sydney, and the generally wealthy upper north shore.
How did working at home vary by workplace location?
Here’s a chart showing the worked at home share for the Melbourne and Geelong region, by workplace location.
The highest worked at home rate was 47.5% seen on French Island – a sparsely populated island south-east of Melbourne which contains many small farms and some tourist facilities. Other worked-at-home hotspots include the Point Cook East SA2 (which includes an air force base) and Panton Hill – St Andrews (which I understand contains many small farms). In fact, worked-at-home rates were again generally much higher in peri-urban areas and very low in suburban areas.
Some of the lowest rates of working at home were seen for employees in industrial areas and at Melbourne Airport. Many of these jobs are probably hard to do remotely.
2.0% of Melbourne CBD workers worked at home on census day in 2016. And the SA2s surrounding the CBD were all below 3%.
Here’s the same map for Sydney:
Again the highest rates of employees working at home were seen in peri-urban areas, and the Sydney CBD saw 1.9% of employees working at home.
These maps tell us that working at home in 2016 was most common in peri-urban areas, and relatively rare in dense employment areas such as CBDs. The COVID19 pandemic triggered significant levels of working at home during lockdown periods which emptied central city office towers and has remained quite common ever since. So it is likely that the profile of people working at home has changed significantly since 2016 to include a lot more white collar workers.
The fact that working at home rates were high in peri-urban areas when measured as both home location and work location suggests that for many people their home is their workplace. So…
How common was remote working in 2016?
You might have noticed that I’ve been referring to “worked at home” rather than the currently popular term “working from home”. That’s not just because its the wording used by the ABS in reporting the census, but because “working from home” is a little ambiguous as to whether people are working at home and away from their regular workplace, or whether their home is also their regular workplace. Perhaps a better term to describe people working at home and away of their regular workplace is “remote working”.
I have extracted worked-at-home workers’ home and work SA2 locations for people who lived and worked in Greater Melbourne and found that 89% of workers who worked at home, had their usual place of work in the same SA2 as where they lived (SA2s are roughly the size of a suburb).
So while 4.5% of workers who both lived and worked in Greater Melbourne worked at home in 2016, only 0.48% worked at home on census day when their regular workplace was in a different SA2. Remote working was an order of magnitude smaller than working at home.
Now it is also possible that some workers who lived and regularly worked in the same SA2 were actually working at home remote from their workplace on census day. However I expect this to be rare, and some further analysis (detailed in the appendix to the post) found that the almost every worker who worked and lived in the same SA2 had their home SA1 area intersect or overlap with their workplace Destination Zone (both the smallest census land areas available). This doesn’t guarantee that their home was their regular workplace, but it makes it quite probable. These workers would mostly not have had a very long commute, so there would be little incentive to remote work to avoid commuting effort. Also, I’ve found people who travelled to work in the same SA2 as they lived were slightly more likely to work in accommodation and food services, construction and retail trade – industries that are likely to require worksite attendance.
So I think I can fairly safely estimate the 2016 remote working rate in Greater Melbourne to have been 0.5%.
I’ve repeated this calculation for Australia’s six largest cities:
I’ve ordered the cities by working population, and you can see remote working rates decline across the chart for smaller cities. This might reflect there being a larger incentive to avoid longer and/or expensive commutes in larger cities by remote working.
Curiously Brisbane had the highest rate of workers whose home doubled as their workplace (4.9%), while the Australian Capital Territory (i.e. Canberra) had the lowest rates of both working at home and remote working.
I think these quite small estimated rates of remote working are an important finding, as several recent reports from the Productivity Commission, SGS Economics and Planning, Monash University, and iMove may have conflated working from home with working remotely at home, at least in their discussion of the topic. It’s critical that these metrics are not mixed up. And thankfully I’m not aware of any obvious miscalculations in their work.
How did rates of remote working vary across workplace locations in 2016?
The following maps exclude people who lived and worked in the same SA2, to get an estimate of remote working by workplace SA2:
The estimated remote working rate peaked for the Docklands SA2 at 1.8%, with Melbourne’s CBD at 1.7%, Southbank at 1.5%, and Albert Park at 1.4%. These are higher than the worked-at-home rates calculated above for all employees who regularly worked in the city centre, because they remove people who regularly work at their home in the central city.
There were also some seemingly random suburban locations with similar rates of remote working such as Forest Hill and Fawkner at 1.6%.
Here’s the equivalent map for Sydney:
There was a curious hot spot of West Pennant Hills at 5.5%, while the Sydney CBD area was 1.8%, North Sydney – Lavender Bay 2.3%, Macquarie Park – Marsfield 2.0%, and North Ryde – East Ryde 1.8%.
How did rates of remote working vary by home SA2?
Here’s a map estimating remote working rates by home location for Melbourne in 2016:
Generally higher rates were seen in peri-urban areas with Flinders at 2.0%, Mount Eliza at 1.4%, Gisborne at 1.2%, and Panton Hill – St Andrews at 1.6%. This may reflect “sea-changers” and “tree-changers” avoiding a long commute to work. The lowest rates were seen in the more disadvantaged areas of Melbourne, which probably reflects such employees being more likely to work in occupations that require attendance at their workplace.
And for Greater Sydney:
Higher rates of remote working were seen across the upper north shore, with Avalon – Palm Beach at 2.4%, and in many peri-urban areas. But the highest rate was seen at Blackheath – Megalong Valley (in the Blue Mountains) with 3.5%.
In what occupations and industries was remote working more common in 2016?
It’s stretching what you can do with ABS TableBuilder, but I’ve extracted counts of workers by home SA2, work SA2, industry main code, and whether the worker travelled to work or worked at home, for Greater Melbourne for 2016. I’ve then filtered for workers whose regular workplace is not in their home SA2. It’s a little problematic in that about one quarter of the non-zero records in this data were a value of 3, and ABS never reports counts of 1 or 2 as it uses randomisation to protect privacy for very small counts. So the totals are accumulating the impacts of lots of small random adjustments, but it’s not clear that this would introduce a bias to the overall estimate, but we should still treat these with caution and I’m not going to quote more than one decimal place. That said, the estimates do seem very plausible:
The industries with the highest estimated rates of remote working are mostly white collar jobs, whilst those industries with the lowest rates are more blue collar.
I did the same analysis for occupations, and again there are few surprises in the estimated rates of remote work across the categories:
What will the 2021 census tell us?
The 2021 census was conducted during a period of tight lockdowns in Victoria and New South Wales. Most other states had relatively few restrictions, but had experienced lockdowns in 2020, so were arguably in a “post pandemic” scenario – at least temporarily. So it will be very interesting to compare 2016 rates of remote working to those in different cities in 2021. For cities that were not in lockdown we will likely get a good sense of which occupations had high rates of (unforced) remote working, which will be very useful for modelling future rates of remote working and the ongoing impact on transport demand.
I expect the patterns across industries and occupations will be similar between 2016 and 2021, but with much higher rates of remote working in 2021.
The data will be released in October 2022 and I’ll be keen to calculate remote working estimates and share those on the blog.
Appendix: Did anyone live and work in the same SA2 but not have their workplace at their home?
To try to answer this I extracted data for “worked at home” cases in Greater Melbourne at the maximum available resolution – SA1 for home location and Destination Zone for workplaces, and determined whether their home SA1 intersected with their workplace Destination Zone. An intersection between these areas doesn’t guarantee the workplace is at their home, but the absence of an intersection does guarantee that the workplace is not at their home.
Here’s a map extracted from maps.abs.gov.au that shows 2016 destination zone boundaries in blue, and SA1 boundaries in red for part of the northern suburbs of Melbourne:
I dare suggest that if someone lived in an SA1 that intersected with their regular workplace Destination Zone, it’s pretty likely that they ordinarily worked at home.
This analysis is stretching the data, because when you extract small counts from ABS they apply random small adjustments to protect privacy and also you never see a count of 1 or 2 people. Problematic as it is, the sum of people living and working in the same SA2, but living in an SA1 that does not intersect the destination zone in which they work was just 95 for all of Greater Melbourne, out of around 70,000 people who lived and worked in the same SA2. This is a lower bound on the true number, but I expect the true number to still be very small. Hence I’m comfortable with an estimate of 0.5% remote working in Melbourne in 2016 (to one decimal place).
Another potential issue is that SA2s are not consistently sized across cities, and are generally smaller in Brisbane and Canberra. This means remote working from a nearby workplace would be more likely to be detected those cities. However I suspect these instances will still be tiny, and the estimated remote working rates in Brisbane and Canberra certainly don’t appear to be outliers.
It’s that time of year again when BITRE release their annual yearbook chock full of numbers, and this post aims to turn them into useful information. It’s also a prompter for me to update my feeds of other transport metrics and pull together this post covering the latest trends in licence ownership, motor vehicle ownership, transport emissions, vehicle kilometres, passenger kilometres, freight volumes, and transport pricing.
I’ve been putting out similar posts in past years, and commentary in this post will mostly be around recent year trends. See other similar posts for a little more discussion around historical trends (January 2022, December 2020, December 2019, December 2018).
Driver’s licence ownership
Here is motor vehicle licence ownership for people aged 15+ back to 1971 (I’d use 16+ but age by single-year data is only available at a state level back to 1982). Note this includes any form of driver’s licence including learner’s permits.
Technical note: the ownership rate is calculated as the sum of car, motorbike and truck licenses – including learner and probationary licences, divided by population. Some people have more than one driver’s licence so it’s likely to be an over-estimate of the proportion of the population with any licence.
Overall the trend has been a flattening of licence ownership rates, and indeed Victoria was showing declining licence ownership before the pandemic. The ACT and Northern Territory had much higher rates of licence ownership in the 1970s compared to other states. But then the Northern Territory has maintained lower rates of licence ownership than most other states since the 1990s. The ACT showed very high rates of licence ownership around 2009 to 2017 – not sure if this is real or an artefact of the imperfect data (eg counting people with multiple licences).
Most states saw an uptick in 2021 with the notable exception of Western Australia – a state that was largely COVID-free until early 2022 so any COVID-avoidance incentive to get a driver’s licence might not have been very strong. Licence ownership rates in Queensland and Victoria have somewhat levelled out between 2021 and 2022, perhaps reflecting a return of international arrivals and the end of COVID lockdowns.
Here’s licence ownership by age band for Australia as a whole (to June 2021):
In 2020 and 2021 there was an uptick in ownership for people aged 16 to 29 in particular. Let’s look at the various age bands across the states:
There are some interesting recent trends for people aged 16-19. Victoria saw a big drop in 2020 but then some big increases in 2021 and 2022. South Australia and New South Wales have also seen big increases in recent years.
There were even bigger increases for 20-24 year olds following the start of the pandemic, except Western Australia and the Northern Territory (states that largely avoided COVID in 2021).
Ages 25-29 were similar:
So why have licence ownership rates increased for younger adults? Is it mode shift away from public transport to avoid the risk of COVID infection on public transport? Or is it because non-licence holders left the country?
South Australia and New South Wales publish quarterly licencing data by age band which allows us to see the impact of the pandemic more closely. I’ve combined this with ABS quarterly population data to calculate quarterly licence ownership rates:
South Australia has less historical data published:
The population aged 20-24 declined after March 2019 in both New South Wales and South Australia – a year before the pandemic hit. Then both states saw a more rapid decline after March 2020 – the onset of the pandemic.
However the number of people in this age band with a licence only increased slightly – in line with pre-pandemic trends. That is, the licence ownership rate increased sharply primarily because there was a net loss of non-licence holders.
Here’s a look at Australia’s population by age band:
There are some fairly smooth trends over time in all age bands, but then from 2020 there were some sudden shifts, particularly for age bands 16-19, 20-24, 25-59 and to lesser extent 30-39.
A plausible explanation is that international students and other non-permanent residents left Australia – many could not attend classes and were encouraged to leave Australia by the government of the day. These departures were not replaced by new arrivals as the international borders were essentially closed. Indeed once the borders reopened in early 2022, there was a sharp increase in non-licence holders in New South Wales that sent the motor vehicle licence ownership rate down sharply in March 2022 (June 2022 data has not been published at the time of writing).
Other data shows a sharp fall in the number of international students in Australia between 2019 and 2020, particularly in NSW, Victoria and Queensland (more recent student numbers unfortunately not available at the time of writing):
And there was a dramatic shift to net outbound overseas migration from the June quarter of 2020:
[Side note: the first quarter of 2022 represented a new record for international migration into Australia as the borders re-opened – almost 98k people.]
It’s entirely plausible that long-time residents also increased their rate of licence ownership during the pandemic, but I think the most likely major explanation is the departure of international students and temporary residents. And so I expect the return of international migration will result in lower licence ownership, car ownership, and increased public transport mode share in 2023.
For completeness, here are licence ownership rate charts for other age groups:
There appear to be a few suspicious outlier data points for the Northern Territory (2019) and South Australia (2016).
To get a better understanding of recent trends, here are quarterly licence ownership rates by age band for New South Wales since mid 2018:
You can see the rise – and more recent fall – in licence ownership rates for the age bands 20-24 and 25-29. There was also a sharp fall for those aged 16-19 in September 2021, possibly due to Sydney entering a long COVID lockdown in the winter of 2021 (perhaps learners permits were not renewed or people didn’t bother applying for them if they could not take lessons). 30-34 year olds showed a small rise in licence ownership from the start of the pandemic and this seems to have been sustained, which might reflect some mode shift to avoid infection risk.
Here’s the same quarterly data for South Australia:
Licence ownership rates rose strongly for those aged 16-34, although there was an initial dip for those aged 16-19 in June-September 2020 around the start of the pandemic. Perhaps it has remained high because international students have not yet returned in great numbers to Adelaide, and/or because of a permanent mode shift towards private transport?
For completeness, here are motor cycle licence ownership rates:
Motorcycle licence ownership has been trending up slightly in New South Wales and Victoria, and slightly down in Queensland, South Australia, Norther Territory and Western Australia.
Car ownership
Thankfully BITRE has picked up after the ABS terminated it’s Motor Vehicle Census, and are now producing a new annual report Motor Vehicle Australia. They’ve tried to replicate the ABS methodology, but inevitably have come up with slightly different numbers in different states for different vehicle types for 2021. So the following charts will show two values for January 2021 – both the ABS and BITRE figures so you can see the reset more clearly. I suggest focus on the gradient of the lines between surveys and try to ignore the step change in 2021.
Between January 2020 and January 2022 most states show an upwards trend in motor vehicles per population aged 18-84 (an imperfect approximation of the driving age population).
However when you look at the stock of cars per state, there was not a significant uptick in the total number of cars – indeed Victoria saw an almost flattening of total motor vehicles between January 2020 and January 2021:
Again, a highly plausible explanation is that non-driving (and non-licence holding) residents departed Australia while long-term residents largely continued their background trends in motor vehicle ownership. We might therefore see a decline in motor vehicle ownership rates in the January 2023 survey with the return of overseas immigration.
Transport Emissions
Australia’s transport emissions have been reduced by COVID lockdowns over the last couple of years but have more recently bounded back:
The above chart showing rolling 12 months emissions which washed out the lockdown period. The next chart shows seasonally-adjusted quarterly data to get around the rolling 12 month averaging – with the September 2022 quarter close to 2019 levels:
Here are Australian transport emissions since 1975:
And in more detail since 1990:
The next chart shows the more recent growth trends by sector:
Aviation emissions saw the biggest decline from the pandemic but were bouncing back in 2021-22. Car and bus emissions have declined in line with pandemic lockdowns whilst most other modes have continued to see growth in emissions.
Here are per-capita emissions by transport sector (note: log scale used on Y-axis):
Truck and light commercial vehicle emissions per capita have continued to grow while many other modes have been declining, including a continued reduction in car emissions per capita since around 2004.
Next up, emissions intensity (per vehicle kilometre):
Curiously the figures suggest a sudden drop in bus emissions per km in 2022, but I am not sure this is plausible as electric buses are still only being rolled out in small numbers. There was also an unexpected dip in emissions per km in 2015 which jumped back up in 2016. The 2015 dip in bus emissions per km is primarily a product of a dip in BITRE’s estimated bus emissions and not bus vehicle kilometres travelled, which is a hard to explain (this bus emissions dip is not seen in AGEIS estimates). I suspect this may be an artefact of BITRE methodological issues.
Emissions per passenger-km can also be estimated:
Car emissions have continued a slow decline, but bus and aviation emissions per passenger km increased in 2021, presumably as the pandemic reduced average occupancy of these modes.
Vehicle kilometres travelled
Vehicle and passenger kilometre figures have been significantly impacted by COVID lockdowns in 2020 and 2021, and so the financial year figures are a mix of restricted and unrestricted travel periods. Accordingly we cannot readily infer new trends from this data, and it should be interpreted with caution.
Total vehicle kms for 2021-22 were lower than 2019-20 and 2020-21:
As per emissions, the biggest declines were in cars, motorcycles, and buses:
Light commercial vehicles and trucks have shown the biggest increase since 1990.
Here’s the view on a per-capita basis:
Vehicle kilometres per capita peaked around 2004-05 and were starting to flatline in some states before the pandemic hit with obvious impacts.
Here is the same data for capital cities (capital city population data comes out only once a year with some delay, so most city data points are only up to financial year 2020-21).
Canberra has dramatically reduced vehicle kilometres per capita since around 2014 leaving Brisbane as the top city.
Once again BITRE have kindly supplied me data on estimated car vehicle kilometres for capital cities that is not included in the yearbook:
Canberra is still on top for car kilometres per person but this rate has been reducing strongly over recently years.
Passenger kilometres travelled
Here are passenger kilometres travelled overall (log scale):
The pandemic had the biggest impact on rail, bus, and aviation passenger kilometres.
Here is the same on a per-capita basis which shows very similar patterns (also a log scale):
Curiously aviation passenger kilometres per capita peaked in 2014, well before the pandemic. Rail passenger kilometres per capita in 2019 were at the highest level since 1975 before the pandemic hit. Only air travel has rebounded on a financial year basis.
Here’s total car passenger kilometres for capital cities:
Melbourne, Sydney, and Canberra were impacted by extensive lockdowns in 2021-22, while the other cities were mostly lockdown free. However the then-unprecedented large wave of COVID cases in the summer of 2021-22 may have led to voluntarily suppressed travel behaviour across many cities.
Here’s car passenger kilometres per capita (again only to 2020-21 for most cities):
It’s hard to estimate any post-COVID trends based on this annual data. However, I have been processing VicRoads traffic signal count data which gives some indication about more recent traffic volumes in Melbourne. The following chart shows the change from 2019 median signalised intersection traffic count volumes per week. I’ve deliberately locked the scale as -20% to +10% as I want to focus on the difference between 2019 and 2022 traffic, and so the 2020 and 2021 lines go off the scale during lockdowns.
It’s very interesting that volumes in late 2022 were about 5% lower than 2019 levels on weekdays (a bit higher on weekends although there’s no such thing as a normal weekend).
And if you look at the time of day profile for Melbourne (below), the biggest reductions have been in the early AM peak, and evenings, while there have been increases during the AM and PM school peaks (which might be a response to COVID infection fear and/or because parents working from home can more easily drive their children to and from school):
Rail Passenger travel
The pandemic has put a large dent in rail passenger kilometres travelled, and these are likely to remain below 2019 for some time as new working-from-home behaviours stick following the pandemic:
Melbourne saw a slight increase in 2021-22, but this was probably more a product of the how long the city was in lockdown during financial years 2020-21 and 2021-22. Sydney saw a reduction in 2021-22 probably because there was little in the way of lockdowns in 2020-21.
Here’s rail passenger kms per capita (again, only up to 2020-21):
Bus passenger kilometres have reduced significantly with the pandemic:
Including on a per-capita basis:
I would expect to see these figure bounce back up as there are unlikely to be any lockdowns during 2022-23.
It would appear that the surge in Darwin bus use due to a major LNG project may have ended.
Mode split
It’s possible to calculate “mass transit” mode share using the passenger kilometres estimates from BITRE (note: it’s not possible to readily differentiate public and private bus travel):
Mass transit mode shares have taken a large dive during the pandemic, and I expect this to be strongly associated with COVID lockdowns where many people – especially central city workers – worked from home. It’s still difficult to know to what extent this is people switching travel modes for ongoing trips, to and what extent it is public transport trips being replaced by staying home. I hope to have more to offer on this subject in an upcoming blog post.
Transport for New South Wales conducts a rolling household travel survey, although it was suspended during COVID lockdowns in 2020 and 2021. Estimated total person trips and kilometres by mode are reported, and from this we can get an idea around mode split (including non-motorised modes):
On this data, the public transport mode share of person kilometres travelled is much higher than that derived from the BITRE data, with a peaking of around 20% before the pandemic.
Unlike Victoria, New South Wales unfortunately does not provide any detailed household travel survey data, which means it is not possible to perfectly calculate public transport mode share (ferry and light rail were bundled with “Other” pre 2020), and it’s also not possible to calculate mode share by trip purpose. All this and more is possible with Victorian published data, but unfortunately post-COVID data will not be published until late 2024.
Freight
This data shows a dramatic inflection point in freight volume growth in 2019, with a lack of growth in rail volumes and a decline in coastal shipping. Much of this volume is bulk commodities, and so the trends will likely be explained by changes in commodity markets, which I won’t try to unpack.
Non-bulk freight volumes are around a quarter of total freight volume, and are arguably more contestable between modes:
2022 saw a sudden flatlining in non-bulk freight volumes, with road increased market share to 80%, seemingly mostly at the expense of coastal shipping:
Air freight tonnages are tiny in the whole scheme of things so you cannot easily see them on the charts.
Transport Costs
The final category for this post is the real cost of transport from a individual perspective. Here are headline real costs (relative to CPI) for Australia, using Q2 ABS Consumer Price Index data up to June 2022:
Technical note: Private motoring is a combination of factors, including motor vehicle retail prices and automotive fuel. Urban transport fares include public transport as well as taxi/ride-share (which possibly move quite independently, which is a little frustrating).
The cost of private motoring mostly declined in real terms from around 2008 to 2020, followed by sharp increases in 2021 and 2022 in line with the rapidly rising cost of automotive fuel. The real cost of motor vehicles has plummeted since 1996, although it bottomed out in 2018.
Urban transport fares (a category which unfortunately blends public transport and taxis/rideshare) have increased faster than CPI since the late 1970s, although they were flat in real terms between 2015 and 2020, then dropped in 2021 and 2022 in real terms – possibly as they had not yet been adjusted to reflect the recent surge in inflation.
The above chart shows a weighted average of capital cities, which washes out patterns in individual cities. Here’s a breakdown of the change in real cost of private motoring and urban transport fares since 1973 by city (note different Y-axis scales):
Technical note: I suspect there is some issue with the urban transport fares figure for Canberra in June 2019. The index values for March, June, and September 2019 were 116.3, 102.0, and 118.4 respectively.
Urban transport fares have grown the most in Brisbane, Perth, and Canberra – relative to 1973. However all cities have shown a drop in the real cost of urban transport fares in June 2022 – as discussed above.
If you choose a different base year you get a different chart:
What’s most relevant is the relative change between years – eg. you can see Brisbane’s experiment with high urban transport fare growth between 2009 and 2017 in both charts.
Melbourne recorded a sharp drop in urban transport fares in 2015, which coincided with the capping of zone 1+2 fares at zone 1 prices.
What does all this mean for post-pandemic transport trends?
I also tackled this question a year ago and my thoughts haven’t changed significantly.
One thing that has become clearer is that the increase in motor vehicle licence ownership and car ownership is very likely related to the lack of recent international immigrants during the pandemic. Therefore the reopening of international borders is likely to push these rates down once more across 2022 and 2023, although they may or may not return to pre-pandemic levels. In turn, this will probably increase public transport patronage and mode share, although it is still likely to remain subdued following the wide scale acceptance and adoption of working from home, particularly for central city workers.
A key question for me is the extent to which commuter trips have shifted from public to private transport, as opposed to simply disappearing as many more people work from home. I’ll have more to say on this soon in an upcoming post about 2021 census journey to work data.
10 August 2021 was an Australian census like no other. Sydney and Melbourne were under fairly strict “lockdown” restrictions due to the COVID19 pandemic, Brisbane was two days out of a lockdown, while Adelaide, Perth, and Canberra had temporarily eliminated COVID and were living a life of few restrictions.
So how did the way people go to work change? There’s lots to unpack on this question and I’ll do that over a few blog posts.
This post will focus on how many people worked from home in 2021, how many of these people were working remotely, how this compared across locked-down and COVID-free cities, which occupations were more likely to work from home in different cities, and what this might mean for future public transport patronage. I’ll also have a quick look at what proportion of employees were not working on census day.
What was happening on Census day 2021?
Melbourne and Sydney were in “lockdown” with workers required to work from home if possible, Brisbane was just out of lockdown, while the other cities were pretty much COVID-free, although Adelaide had experienced a short lockdown in July 2021. Here’s a summary of some key metrics (CBD office occupancy sourced from the Property Council):
*The Property Council reported a figure of 60% for August 2021, but this would have been illegal on 10 August as there was a 50% capacity limit. We don’t know the exact dates when the survey was conducted, I can only assume later in that month when restrictions were eased. 47% of Brisbane CBD employees reported working at home on census day.
How have mode shares changed between censuses?
Given working at home now represents a much more significant share of all workers, I’ve calculated public transport mode shares both including and excluding people who travelled to a workplace:
It will be no surprise that public transport mode shares dropped dramatically in most cities. The biggest mode share drops were in the locked down cities of Melbourne and Sydney, but there were large falls also in Brisbane and Adelaide (which was also impacted by closure of the Gawler train line during 2021). Relatively COVID-free Canberra and Perth saw more modest reductions in line with the trend from 2011 to 2016, and for Canberra there was little change in the public transport mode share of people who did travel to work.
Here’s a look at the total mode split (including people who worked at home as a “mode”):
The largest rates of working at home in 2021 were unsurprisingly in the most COVID-impacted cities at the time.
The biggest mode shift in 2021 was from public transport to working-at-home, but there were also mode shifts away from active transport and private transport, even in the COVID-free cities.
How many people were working remotely?
All of Australia had experienced COVID lockdowns in March 2020, and for that period a significant portion of the workforce suddenly transitioned to working at home. What was a fringe activity in 2016 suddenly became the new normal for many employees and employers. This was most acutely noticed in the central business districts of our cities where office workers went almost entirely remote.
As discussed in my previous post on this topic, historically most people who worked at home on census day reported their work SA2 as the same as their home SA2, and I am assuming the vast majority of these people have their home as their regular workplace.
To better understand working at home, I’ve extracted worked at home counts from the 2011, 2016 and 2021 censuses, and then split the “worked at home” workers by whether or not their workplace SA2 was the same as their home SA2.
This allows an estimation of the number and share of people who worked remotely and those who regularly worked at home. I say estimation because the ABS aims to protect privacy by “randomly” adjusting small numbers in downloadable data and never reports values of 1 or 2. When I add up the number of people remote working within Greater Melbourne in 2021, 22% of that total comes from counts of 3 people between specific home SA2 – work SA2 pairs (Sydney was 21%, Brisbane 24%, Perth 29%). The true count for many of these pairs will not be exactly 3 people, so summing lots of small volumes that are “randomly adjusted” may result in a biased accumulation of small number errors. For 2011 and 2016 the summation of remote workers includes an even larger share of 3s so I’m not going to give the summation value here, but I’m confident the true summation is still tiny (much less than 1%).
These imperfect estimates of “home in work SA2” share and “remote working” shares don’t perfectly add up to the known total working at home share for the city (eg Sydney the sum was 2% over the actual for 2021 but other cities were pretty close). For want of a better method, I’ve scaled these estimated volumes such that their sum equals the known total worked at home volume, and I’m not going to quote any decimal places.
Here are my estimated shares of workers who classify as “remote working” and “home in workplace SA2” by census year:
The pre-COVID regularly working at home rates were mostly around 4-5%, but this was estimated to have increased significantly in Sydney, Melbourne, and Brisbane in 2021. I suspect this is a mix of people who gave up their regular workplace and permanently shifted to working at home and some people who filled in the census inaccurately and indicated that their workplace at the time was their home, even though that might have been a temporary arrangement during COVID restrictions.
The COVID-free cities experienced remote working rates of only 4-6%, whereas the heavily restricted cities of Sydney and Melbourne had remote working rates of 36% and 26% respectively.
Where was remote working most common?
What follows are maps showing estimated rates of remote working for workplace SA2s across the five big cities. There’s definitely an issue of aggregating many small numbers that are ‘randomly adjusted’, so I’m not going to report exact numbers, but rather classify SA2s into bands.
Here are the remote working hotspots for Sydney:
The highest rates of remote working were seen for workplaces in the dense employment areas of central Sydney, North Sydney, Macquarie Park / Ryde, Parramatta, Rhodes, and Kensington (which is dominated by a university campus). All white collar hotspots.
Here’s Melbourne:
Melbourne had a lot fewer remote working hotspots, in line with it having a lot fewer suburban employment clusters (see: Suburban employment clusters and the journey to work in Australian cities). Apart from the central city and inner suburbs, remote working hotpots included SA2s with large university campuses such as Kingsbury, Burwood, and Hawthorn.
Remote working was less prevalent in Brisbane so I’ve used a different colour scale:
And for the COVID-free cities I’ve used an even smaller colour scale and focussed on SA2s that had rates above 5%.
Adelaide:
I’m not sure why there was a relatively high rate of remote working in Lockleys in the inner-west. Does anyone have any thoughts on this?
Canberra:
Perth:
Remote working was unsurprisingly more common in CBDs, some inner-city SA2s that contain concentrations of white collar employment, and some suburban SA2s that contain universities.
Central business districts are obvious areas to see high levels of remote working. My next post in this series will focus in more detail on changing commuter patterns for CBD workers in Australia’s five biggest cities.
Which occupation types transitioned to working at home?
The following chart shows the rates of working at home by occupation for locked down Sydney and Melbourne in 2021:
As you read down the occupations listed there are no great surprises, with white collar jobs showing much higher rates of working at home. I’ve classified the occupations into four different bands of working at home rates based on conditions in locked-down Sydney and Melbourne. I’ll re-use these groupings for other cities shortly.
Many of these occupations had high public transport mode shares in 2016 (at least for Greater Melbourne), which is consistent with the dramatic drops in public transport volumes and mode share:
Many of the occupations with high public transport mode share in 2016 had high rates of working at home in 2021 (top right quadrant of the chart).
How do locked down cities compare to COVID-free Perth in 2021? The following chart includes Sydney and Perth for comparison purposes:
The occupations with relatively higher rates of working at home in Perth 2021 were fairly similar to those in Sydney, just at a much smaller scale (about four times). Occupations with much lower working at home rates in Perth than Sydney include education workers (schools and universities were not running remotely in Perth). Arts and media professionals topped working from home in Perth – but this occupation group also had relatively high rates of working at home in 2016. Other occupations with high levels of working from home in Perth were famers and farm managers (for obvious reasons) and ICT professionals (likely very adaptable to working remotely).
The following chart again compares 2021 working from home mode shares with 2016 public transport mode shares, but this time for Perth:
The same white-collar jobs appear in the top-right of the chart, suggesting a significant mode shift from public transport to working at home.
Here’s a look at public transport and worked-at-home mode shifts by occupation across the six big cities:
You can clearly see the relationship between public transport and home-working mode shifts, particularly for Sydney, Melbourne, and Brisbane. The relationships is very roughly that the working at home mode shift was around double the public transport mode shift. However the relationship is a little less clear in Adelaide, Perth, and Canberra.
I think this tells us that occupations that had high rates of public transport use in pre-pandemic times are mostly the same occupations that are highly amenable to working remotely. And of course these occupations have concentrations of workers in CBDs (hence the high use of public transport). To the extent that employers facilitate ongoing working from home, there will likely be a reduction in public transport commuter volumes. From a congestion and emissions point of view, that’s undoubtedly a good thing. There are of course also arguments about the agglomeration benefits of workers being physically in the same place.
Are occupations more amenable to working from home on the rise?
Thinking to the future, are these occupations with higher rates of working at home in 2021 on the rise or decline? The following chart attempts to answer this question:
Unfortunately I’m not sure the chart provides a clear answer. Many people were simply unable to work due to lockdowns on census day in Sydney and Melbourne. They aren’t on the chart. This appears to skews the overall share of jobs by category in those cities to the “High” end.
In the COVID-free cities, there doesn’t appear to be a clear trend over time. In 2016 the “High” occupations reduce share in all cities but then bounced back up in 2021.
However one important insight from this chart is that Canberra has the largest share of “High” occupations – followed by the bigger cities of Sydney and Melbourne. These cities are likely to have more specialist white collar professionals, and therefore they may have higher overall rates of ongoing remote working in the post-pandemic world. Public transport patronage will likely take longer to return to pre-pandemic levels these cities.
One final thing…
How many people were not working on census day in 2021?
Not every employed person works on census day, perhaps because they work part-time, casual, shift-work, or were unable to work that day. And of course in August 2021 a lot more people than usual were unable to work in Sydney and Melbourne. Here’s a look at the share of employed people who did not work on census day, by occupation category and census year:
After a downwards trend between 2006 and 2016, most occupation categories in most cities had a big uptick in not working on census day in 2021, most notably in Sydney where there were very strict lockdown rules. Curiously these upticks were present even in COVID-free cities like Adelaide, Perth, and Canberra, possibly reflecting an overall economic downturn, a lack of interstate and international travel, supply chain breakdowns, and/or maybe some other factors.
I hope you’ve found this post interesting. I’ll be unpacking more census data in some upcoming posts, including a more detailed look at CBD workers and a look at changes in demographics – particularly from the impact of suspending immigration during the pandemic. Stay tuned.
The bustling Central Business Districts (CBDs) of Australia’s biggest cities were the powerhouses of the Australian economy, underpinned by public transport networks that delivered hundreds of thousands of commuters each weekday. But the COVID19 pandemic significantly disrupted CBD commuting. Working remotely from home became not just acceptable, but temporarily mandatory, and public transport patronage crashed during lockdowns.
So what might be the new normal in a post-pandemic work for commuting to our CBDs? Will people shift from public to private transport, driving up traffic congestion? How many – and what sorts of people – might work from home?
This post will try to shed some light on those questions by examining what the 2021 Australian census can tell us about how travel to our CBDs altered during the COVID19 pandemic, particularly the differences between locked-down and COVID-free cities. I’ll look at patterns and trends by age, occupation, and commuting distance. I’ll finish with a look at recent transport indications in Melbourne.
As a transport planner, I’m particularly interested in CBDs as there is a significant contest for market share between public and private transport. Before the pandemic, public transport dominated commuter mode share in the biggest CBDs, and CBDs make up a significant share of all public transport commuter trips.
Reminder: what was happening on Census day 2021
Melbourne and Sydney were in “lockdown” with workers required to work from home if possible. Brisbane was just out of lockdown, and the other cities were pretty much COVID-free, although Adelaide had experienced a short lockdown in July 2021. Here’s a summary of some key metrics (CBD office occupancy data sourced from the Property Council):
*The Property Council reported a figure of 60% for August 2021, but this would have been illegal on 10 August as there was a 50% capacity limit just after lockdown. We don’t know the exact dates when the office occupancy survey was conducted, I can only assume later in that month when restrictions were eased. 47% of CBD employees reported working remotely on census day.
What is a Central Business District?
I think of Central Business Districts as the civic, commercial, and business centre of a city, generally characterised by an area dense employment. Unfortunately the ABS’s SA2 boundaries don’t really align with these areas – especially Perth (pre 2021) and Adelaide where the SA2s covering the CBD also included areas of single-storey semi-detached housing.
So for this analysis I’ve created my own CBD boundaries for Australia’s five largest cities. I’ve selected a set of destination zones that were relatively dense in 2021. I’ve tried for reasonably smooth boundaries, and have tried to avoid under-developed areas that might have cheaper car parking. I’ve then created equivalent sets of 2011 and 2016 destination zones – as similar as possible to the 2021 boundary – with the one exception of the Melbourne CBD from which I have excluded south-western parts of Docklands in 2011 due to low employment densities in that year (much of the land was yet to be developed and instead occupied by surface car parking).
Here are maps of these CBD areas. I’ve transparently shaded the CBD for each census year in a different colour which mostly overlap to show dark green. Purple areas are where boundaries are not identical for all years.
Here are the mode splits for those CBD areas, including those who worked at home:
As you would expect, working at home dominated in locked-down Sydney and Melbourne in 2021, but was also quite common in Brisbane and Adelaide. In COVID-free Perth, working at home only accounted for 15.5% of CBD employees with the other 84.5% attending their workplaces on census day.
Public transport mode shares increased between 2011 and 2016 in all CBDs except Brisbane, but then in 2021 there was a significant shift away from all travelling modes to working at home in all cities.
The working at home share may include people who routinely work from their home in a CBD area. To get some idea about these numbers, I’ve split the worked at home share for 2021 into those who lived inside and outside the CBD:
Only a tiny share of CBD workers worked at home and also lived within the CBD. Some of these will have been working remote from their regular workplace and others will have been routinely working at home (I could try to split these apart with deeper analysis but it doesn’t seem worthwhile with such small numbers).
How did working at home vary by age of CBD workers?
A really interesting finding here is that working at home peaked for those in their early 40s in almost all cities – an age with plenty of parents with child caring responsibilities. Teenagers and those in their early 20s were the least likely to work from home, probably because they were more likely to be in jobs not amenable to working at home (eg retail and hospitality). But perhaps also some younger white collar workers may have preferred to build professional networks by being present in the CBD.
In Adelaide and Perth there was a definite trend that younger commuters were more likely to use public transport, and older commuters more likely to use private transport. This was consistent with all cities in earlier censuses (although this was not the case in Brisbane in 2021).
This got me thinking. The COVID19 pandemic and ~18 month border closure surely had some impact on the age distribution of the CBD workforce.
Indeed, here’s a look at the age composition of CBD workers over time:
Between 2011 and 2016 all cities showed a shift in the age composition towards older employees, perhaps as the cohorts of more highly educated Australians got older, people stay in the workforce until later in life, and/or other changing demographics of our cities.
But in most cities (perhaps not Adelaide) there seemed to be a larger shift towards older workers between 2016 and 2021. I suspect this will reflect fewer recent skilled migrants and international students in 2021.
We know from other analysis (see: Why are younger adults more likely to use public transport? (an exploration of mode shares by age – part 1)) that younger adults generally have higher rates of public transport use, so the shift in demographics might be favouring a mode shift away from public transport – all other things being equal (which of course they are not). There was mostly a shift towards public transport for CBD workers between 2011 and 2016, so other factors must have had an overriding impact.
How did working at home vary by CBD worker occupation?
I’ve sorted the occupations by overall worked at home share, which was similar across the cities. This list roughly sorts from blue collar to white collar and I haven’t seen any surprises in this chart. I’ll come back to occupations shortly.
How did working at home vary by distance from work?
The following chart shows working at home rates by approximate distance from home to work, for central area workers.
Technical note: For this analysis I’ve used journey to work data disaggregated by home SA2, work SA2, and whether or not workers worked at home. I’ve defined central city areas as collections of SA2s (so different boundaries to my CBD areas). Distances between home and work SA2s are calculated on SA2 centroids then aggregated to ranges.
In all cities there was a general trend to higher rates of working at home for people living further from the central city, although Sydney rates of remote working were high at all distances (the strictness of lockdown probably overriding the impact of commuting distance). This pattern in other cities likely reflects the increased incentive to work from home when you have a longer commute to avoid.
Did COVID lead to a mode shift from public to private transport?
Some transport planners have been concerned that COVID19 might lead to a permanent mode shift from public transport to private transport, probably for two reasons:
A reduction in total commuter demand might make private transport slightly more competitive (eg if parking costs reduce), resulting in a different mode split equilibrium. We can only really test this aspect in Perth and Adelaide as they were COVID-free but with a small but significant share of workers working remotely.
People have a fear of becoming infected by COVID19 on public transport and therefore switch to private transport (although COVID can also spread in workplaces of course). It’s a bit harder to test this as Sydney and Melbourne were in lockdown (movement restrictions no doubt had much more impact than infection fear). Perth, Canberra, and Adelaide were COVID-free, although there might have been a some fear of undetected COVID circulating – and indeed that was probably happening in Canberra which went into lockdown a few days after the census. Brisbane was just out of lockdown with some restrictions remaining so infection fear may have been higher than in Perth and Adelaide. However the level of infection fear in these “COVID-free” cities in 2021 would certainly be less than that in 2022 and 2023 where COVID is known to be circulating in the community (although there’s since been plenty of opportunity to get vaccinated).
The hypothesis I want to test for COVID-free cities is that there was a mode shift from public transport to private transport, alongside the overall mode shift to working at home.
Okay, so what can census data tell us?
Unfortunately it’s almost impossible to know the behaviour change of individuals who had the same home and work locations in 2016 and 2021 without another data source. I don’t have access to the census longitudinal dataset and that might not even have a sufficient sample of CBD workers who didn’t change home or work location between the two censuses.
But I can explore this question by looking at the changes in overall volumes and mode shares, and then drilling down into different age and occupation cohorts.
How much mode shift was there between travelling modes?
Let’s first look at the overall change in mode split of people who did commute to CBDs in the last three-four censuses (I have 2006 data for Melbourne and Sydney, but only for those who travelled):
On this split, all cities saw a significant mode shift to private transport travel in 2021. The smallest was 4% in COVID-free Perth, while the largest was 18% in locked-down Sydney.
To explore further, here are the total volumes of commuters to CBDs for each mode, across the last three-four censuses:
In the locked-down cities there was a substantial drop in both public and private transport commuters in 2021, although a larger proportional drop for public transport (in line with mode shifts seen above).
But I’m particularly interested in the then COVID-free cities of Adelaide and Perth, that exhibited COVID-free travel behaviour. Let’s start with a deep dive for Perth.
How did commuting behaviour change for Perth CBD commuters between 2016 and 2021?
The overall CBD workforce increased substantially from 83.0k to 105.7k, and this increase saw 5,164 more private transport trips, and about 85 more public transport trips. But the biggest net increase was for working at home.
If we include remote working, the overall mode share of private transport declined by 1.6% from 36.5% to 34.9%. Any mode shift from public transport to private transport was swamped by the overall shift to working remotely.
But does the overall pattern mask some mode shifts within age or occupation groups?
Did some age groups shift modes more than others? Initially for this analysis I started to look at the change in modal mix by five year age group, but of course the people within these 5 year age bands entirely change between censuses (that are held five years apart), so that wouldn’t be measuring behaviour change of a similar group of people.
Instead I’ve looked at the change in modal mix by approximate birth year cohorts (we only know people’s age in August, so the birth year groups are approximate – for example someone aged 25 at the 2021 census could have been born anytime between 11 August 1995 and 10 August 1996, but I’ve allocated them to the 1996 to 2000 cohort).
Here is the net change in volume of Perth CBD workers by birth year cohort and commuter mode (I’ve included the age of this cohort in 2021 at the bottom of the chart for reference).
As you would expect, people aged in their 20s in 2021 made up a significant share of new CBD employees, and workers aged 60+ in 2021 (55+ in 2016) had a net reduction as many went into retirement.
Public transport had the largest share of net new trips for those aged 20-24 in 2021, although a substantial share also travelled by private transport. There was a more even split of net new trips for those aged 25-29 in 2021.
There was also substantial employee growth for people aged 30+ in 2021 (unlike in 2016), and for those aged 30-54 in 2021 the biggest change was a net increase in working at home.
There were increases in private transport use and decreases in public transport use for those aged 30 to 54 in 2021. This was a net 2270* commuters – about 2.1% of the overall CBD workforce (*summing the absolute values of the smaller of the public or private transport shift). But the overall private transport mode shift was -1.6% so changes in other age groups (particularly young adults) washed out all of this shift of middle-aged workers.
Was this mode shift for middle aged workers something to do with COVID, or was it something that was destined to happen anyway? On this blog I’ve explored the relationship between age and public transport mode share in great detail, and there’s certainly a pattern of decline with age, particular as people become parents. See: Why are younger adults more likely to use public transport? (an exploration of mode shares by age) – part 1, part 2, and part 3.
What about mode changes for different occupations? Here’s a look at commuter volume changes by mode and occupation for Perth’s CBD:
The Perth CBD put on a lot more professionals and specialist managers between 2016 and 2021, and working at home accounted for most of this net growth. The number of new public and private trips varied considerably by category but private transport growth outnumbered public transport growth for most professions.
In particular, almost all the growth in health professionals, protective service workers, and carers and aides was accounted for by private transport. These are occupations where working remotely from home is often difficult, and the high rates of private transport growth might also reflect significant rates of shift work where off-peak public transport service levels are often less competitive with private transport.
There are not many occupations that saw a net shift from public to private transport – these included office managers, program administrators, and clerical and office support workers. But again these numbers were tiny compared to the size of the Perth CBD workforce – suggesting there was very little net shift from public to private transport.
Overall there was a 1.6% shift away from private transport commuting to the Perth CBD, with most of the other mode shift being from public transport to remote working. The evidence from Perth does not support the hypothesis.
How did commuting behaviour change for Adelaide CBD commuters?
Adelaide saw only a tiny increase in the number of private transport commuters, but a significant decrease in the number of people who travelled on public transport. Overall there was a 5.3% shift away from private transport mode share (when you include remote working).
As per the analysis for Perth, here’s the change in volume of trips by mode and birth year:
For Adelaide most of the net mode shift also appears to be from public transport to working remotely. There was a net increase in private transport commuting for people aged 15 to 34 in 2021, and a small decline in private transport trips for older age groups.
There was only a tiny net shift from public to private transport of 526 people within those aged 30-39 in 2021.
Like Perth, working at home accounted for a smaller share of the employment growth for younger adults.
Here’s a look at occupations for Adelaide:
Again, the biggest mode shift here appears to have been from public transport to working at home, with the notable exception again of carers and aides, and health professionals (although small numbers). In most occupations there was also a mode shift away from private transport. Very few occupations show a net shift from public transport to private transport in Adelaide.
The evidence of Adelaide does not support the hypothesis of mode shift from public to private transport. The biggest change was a mode shift from public transport to remote working (plus some mode shift from private transport to remote working).
How did the mix of CBD car commuters change?
Yet another way of looking at potential mode shifts is whether the people driving to work in the CBD in 2021 were any different to previous censuses. For this analysis I’ve filtered for commuters to CBDs who did not use any public transport, but did travel as a vehicle driver or on motorbike/scooter (you might argue “Truck” should be included as well, but we don’t know whether there people were drivers or passengers and the numbers are tiny so I don’t think it is material).
Firstly here is the occupation split of vehicle drivers to work in the five CBDs over the last three censuses:
In most cities, there was a noticeable change in occupation share between 2016 and 2021 towards technicians and trade, labourers, machinery operators and drivers, and community and personal service workers, and away from professionals and managers. Basically a shift from white collar to blue/fluoro collar jobs, as many white collar workers shifted to working remotely. This shift was largest in the locked down cities of Melbourne and Sydney, but was also visible in Adelaide and Brisbane to a lesser extent.
It is also interesting to look at the change in volumes. Note the Y-axis on the following chart has an independent scale for each occupation group, with the biggest occupation groups at the top:
In locked-down Sydney and Melbourne, there was a massive decrease in white collar workers and an increase in machinery operators and drivers. Melbourne also saw an increase in labourers and community and personal service workers. This might reflect a reduction in car parking prices, although I cannot find evidence that prices were actually lower on census day (the City of Melbourne waived parking fees and restrictions from just after the census).
Diving deeper, there was a big increase in protective service workers in the Melbourne CBD, and about 2166 of them drove to work in 2021 (up from 1660 in 2016). This may reflect the opening of the new Victorian Police Centre in Spencer Street in 2020, complete with 600 car parks. Indeed the destination zone that includes this building (and Southern Cross Station) saw an increase of 769 private transport commuters between 2016 and 2021, the biggest increase of any CBD destination zone.
In COVID-free Perth there was an increase in professionals, clerical and administrative workers, managers, community and personal service workers, and machinery operators and drivers who drove to work, and there was only a decline in sales workers.
So what have I learnt from the latest census data?
I’ve covered a bit of ground, so here’s a summary of key findings and some discussion:
Locked-down Sydney and Melbourne saw a significant shift to remote working of CBD employees in 2021. COVID-free CBDs saw much less shift to remote working (Adelaide 24% and Perth 15%).
Remote working was most common for middle-aged CBD employees (peaking at 40-44 age bracket), and much lower for younger adults and a little less common for older employees.
All CBDs saw a step change in the workforce age composition between 2016 and 2021, shifting to an older workforce, probably related to the halt to immigration during the pandemic.
In most cities, remote working in 2021 was slightly more common for CBD employees who lived further from their CBD.
In all cities, the main mode shift between 2016 and 2021 seems to be from public transport to remote working.
No city saw a net mode shift from public transport to private transport (when you include remote working in the modal mix). The main mode shift in COVID-free cities appears to be from public transport to remote working. However it is entirely possible that some public transport commuters switched to private transport, but this was more than offset by other commuters who shifted from private transport to remote working. Few age or occupation cohorts saw a net shift from public to private transport.
The only CBD to see a significant increase in private transport commuter trips was Perth (with +5164). However this was still a net mode shift away from private transport mode share due to massive growth in overall CBD employment between 2016 and 2021. I’m curious about how this happened, and I will explore it further in an upcoming post.
Occupations likely to include many shift workers saw the biggest net private transport commuter growth in Adelaide and Perth – including health professionals, protective service workers (including police), carers, and aids.
So what can we expect in a “post-pandemic” world?
At the 2021 census all Australian cities were either in lockdown or were perceived to be COVID-free. No Australian cities were “living with COVID”, and in the cities with COVID circulating, few workers faced a choice between workplace attendance and remote working.
At the time of writing (March 2023), COVID is circulating across Australia and there are very few restrictions to restrict spread. There is an ongoing risk of COVID infection when using public transport and attending an indoor workplace (although you can choose to wear a mask of course).
Is this leading to a mode shift from public to private transport in this “post-pandemic” world? Have we even reached a new steady state? The best data to answer this will come from the 2026 census.
In the meantime I have had a quick look at some transport indicators for Melbourne.
Vehicle traffic through CBD intersections in 2022 (excluding Q1) was consistently below 2019 levels in the AM peak in most parts of the CBD. However it’s only a rough indication as much of this traffic will be for purposes other than private transport commuting to the CBD (eg deliveries, through-traffic, buses, etc) (I’ve excluded signals on Wurundjeri Way which is likely to have much through-traffic).
The next chart shows average daily patronage for metropolitan trains, trams, and buses in Melbourne based on published total monthly patronage data but not taking into account the different day type compositions of months between years (I’d much prefer to use average school weekday patronage data to avoid calendar effects, but that data series only ran as far as June 2022 at the time of writing).
This data suggests CBD private transport commuter volumes in 2022 might be a bit below 2019 levels, while there has been a substantial reduction in public transport commuting. This is consistent with what was seen in Adelaide in the 2021 census – mostly a mode shift from public transport to remote working. Furthermore, if there has been a significant increase in Melbourne CBD employment, private transport mode share (when you include remote working) is more likely to have declined below 2019 levels.
Is infection fear still influencing mode choice?
The largest COVID wave in Victoria (so far at the time of writing) occurred in January 2022 peaking at 1229 people in hospital and there was significant public transport patronage suppression (well beyond the usual summer holiday lull) as many people choose to stay home (or were sick and had to stay home). Infection fear was probably having a big impact, as I recall there were few restrictions regarding workplace attendance.
There was also a fairly large COVID wave in winter 2022 peaking at 906 hospitalisations in July, but the above chart shows no significant associated reduction in public transport patronage. This suggests infection fear was probably having a very small impact on transport behaviour in mid-2022.
Certainly in my experience few people are wearing masks on Melbourne’s public transport at the time of writing, but maybe a cautious minority have still not returned to the network.
Emerging indications are that public transport patronage is returning even more strongly in February and March 2023, which might reflect even lower levels of infection fear (hospitalisation numbers have also reached the lowest numbers since September 2021), and/or it might reflect a surge in population growth and CBD employment/student numbers. Things to keep an eye on over time!
With the release of more detailed 2021 census data and June 2022 population estimates, it’s now possible to look more closely at how Australia’s larger capital cities have changed, particularly following the onset of the COVID19 pandemic in 2020.
This post examines ABS population grid data for 2006 to 2023 for Greater Capital City Statistical Areas, including:
Trends in overall population-weighted density for cities;
Changes in the distribution of population living at different densities;
Changes in the distribution of population living at different distances from each city’s CBD;
Changes in population density by distance from each city’s CBD;
Changes in the distribution of population living at different distances from train and busway stations;
Changes in population density in areas close to train and busway stations;
The population density of “new” urban residential areas in each city (are cities sprawling at low density?); and
Changes in the size of the urban residential footprint of cities.
I’ve also got some animated maps showing the density of each city over those years, and I’ve had a bit of a look at how the ABS corrected population estimates for 2007 to 2021 following the release of 2021 census data.
I’ve not included the smaller cities of Hobart and Darwin as they have a small footprint, and too many grid cells are on the edge of an urban area.
Population weighted density
My preferred measure of city density is population-weighted density, which takes a weighted average of the density all statistical areas in a city, with each area weighted by its population (this stops lightly populated rural areas pulling down average density – for more discussion see How is density changing in Australian cities? (2nd edition)).
I also prefer to calculate this measure on a consistent statistical area geography and the only consistent statistical area geography available for Australia is the square kilometre population grid published by the ABS.
With the recent release of 2021 census data, ABS issued revised population grid estimates for all years from 2017 onwards, which saw significant corrections in some cities (see appendix for more details). There has also been a slight change in the methodology for the 2021 grid that ABS say may result in a more ‘targeted representation’, but it’s unclear what that means.
Here’s the revised trend in population weighted density calculated on square km grid geography for Greater Capital City Statistical Areas in June of each year:
Sydney has almost double the population density of most other Australian cities (on this measure), with the exception being Melbourne which sits halfway in between.
Population weighted density was rising in all cities until 2019, although the growth was notably slowing in Sydney from about 2016.
The pandemic hit in March 2020 and led to a flatlining of density in Melbourne and a decline in Sydney by June 2020, while other cities continued to densify. Then Sydney and Melbourne’s population weighted density dropped considerably in the year to June 2021 – probably a combination an exodus of temporary international migrants and internal migration away from the big cities (particularly Melbourne that had experienced long lockdowns). Most other cities flatlined between June 2020 and June 2021.
Then by June 2022 density had increased again in all cities, after international borders reopened in early 2022.
The following chart shows the proportion of the population in each city living at different density ranges over time:
All cities show a sustained pre-pandemic trend towards more people living at higher densities. However the pandemic saw significant drops in people living at the higher density categories in 2021 in Melbourne, Sydney, and Canberra.
So where was this loss of density? The next chart shows the change in population for grid squares across Melbourne between June 2020 and June 2021. Larger dots are more change, blue is an increase and orange is a decline:
You can see significant declines in population (and hence population density) in the inner city areas – so much so that the dots overlap. This is likely largely explained by the exodus of many international students and other temporary migrants.
You can also see population decline around Monash University’s Clayton campus in the south-eastern suburbs.
At the same time there were large increases in population in the outer growth areas, as is normally the case. Other pockets of population growth include Footscray, Moonee Ponds, Box Hill, Port Melbourne, Clayton (M-City), and Doncaster, likely related to the completion of new residential towers.
Here’s the same for Sydney:
There was significant population decline in the inner city and around Kensington (which has a major university campus), and the largest growth was seen in urban fringe growth areas to the north-west and south-west. Pockets of population growth were also seen at Wentworth Point, Eastgardens, Mascot, North Ryde, and Mays Hill, amongst others.
Here is the same for Brisbane:
Inner-city Brisbane was much more a mixed bag, which explains the less overall change in the density composition of the city. Some areas showed declines (including St Lucia, New Farm, Kelvin Grove, Coorparoo) while others saw increases (including Fortitude Valley, West End, South Brisbane, Buranda, CBD south).
Proportion of population living at different distances from the city centre
The next chart shows the proportion of people living at approximate distance bands from each city’s CBD over time:
All cities have seen a general trend towards more of their population living further from the CBD, with the notable exception of Canberra which has seen the outer urban fringe expanding by little more than a couple of kilometres at the most, and substantial in-fill housing at major town centres and the inner city (see also animated density map below). I should note that the Greater Capital City Statistical Area boundary for Canberra is simply the ACT boundary, and does not include the neighbouring NSW urban area of Queanbeyan, which is arguably functionally part of “greater Canberra”.
In 2021, Sydney and Melbourne saw a step change towards living further out, in line with the sudden reduction in central city population.
Population density by distance from a city’s CBD
Here’s an animated chart showing how population weighted density has varied by distance from each city’s CBD over time:
In most cities there has been a trend to significantly increasing density closer to the CBD, with central Melbourne overtaking central Sydney in 2017.
Sydney has maintained significantly higher density than all other cities at most distances from CBDs, with Melbourne a fair step behind, then most other cities flatten out to around 20-26 persons/ha from around 6+km out from their CBDs in 2022.
Canberra appears to flatten out to around 20 persons/ha at 3-4 kms from its CBD (Civic) however it is important to note that Canberra has a lot of non-residential land relatively close to Civic which reduces density for many grid cells that are on an urban fringe (refer maps toward the end of this post).
Population living near rapid transit stations
I’ve been maintaining a spatial data set of rapid transit stations (train and busway stations) including years of opening and closing, and from this it’s possible to assess what proportion of each city lives close to stations:
Sydney has the largest proportion of it’s population living quite close to rapid transit stations, with Perth having the lowest.
There are step changes on this chart where new train lines have opened. Sydney, Brisbane, and Adelaide have been successful at increasing population close to stations. The opening of the Mandurah rail line made a big difference in Perth in 2009 but the city has been growing remote from stations since then (MetroNet projects will probably turn this around significantly in the next few years). Melbourne was roughly keeping the same proportion of the population close to stations although that changed in 2021 with the exodus of inner city residents (I anticipate a substantial correction in 2023).
Population density around rapid transit stations
The following animated chart shows the aggregate population-weighted density for areas around rapid transit stations in the five biggest cities over time:
Sydney has lead Australia with higher densities around train stations, followed by Melbourne. Perth has only slightly higher densities around stations (in aggregate) compared to other parts of the city. Population density is generally lower around Adelaide train and busway stations compared to the rest of the city – the antithesis of transit orientated development.
How dense are new urban areas?
I’ve previously looked at the density of outer urban growth areas on my blog, and here is another way of looking at that using square kilometre grid data.
I’ve attempted to identify new urban residential grid squares by filtering for squares that averaged less than 5 persons per hectare in 2006 and more than 5 persons per hectare in 2022 (using 5 persons/ha as an arbitrary threshold for urban residential areas, and I think that’s a pretty low threshold).
The vast bulk of these grid cells (and associated population) are on the urban fringe, but a handful in each city are brownfield sites that were previously non-residential (for Melbourne 99% of the population of these grid cells are in urban fringe areas).
It’s also not perfect because square kilometre grid cells will often contain a mix of residential and non-residential land uses, but it is analysis that can be done easily and quickly, and in aggregate I expect it will be broadly indicate of overall patterns.
The following chart shows the population of new urban residential grid cells (since 2006), and the proportion of this population by 2022 population density:
You can see Melbourne has almost double the population in these new urban residential grid squares compared to Perth, Brisbane, and Sydney. This indicates Melbourne has been sprawling more than any other city since 2006. Slow-growing Adelaide only put on about 56k people in new urban grid squares, slightly less than Canberra.
The bottom half of the chart shows that new urban grid squares in Sydney, Melbourne, and Canberra are generally much more dense than those in other cities. This likely reflects planning policies for higher residential densities in new urban areas in those cities. In fact, all of these grid cells with density 40+ in 2022 are on the urban fringes, except one brownfield cell in Mascot (Sydney).
But of course planning policies can change over time, so here is the equivalent chart looking at new urban residential squares since 2012:
It’s not a lot different. The density of these more recent new urban residential grid cells is generally highest in Sydney, following by Melbourne and Canberra. New urban residential grid cells in Adelaide mostly had fewer than 20 persons/ha, but then also there are not that many such grid cells and they didn’t have much population in 2022.
How much has the urban footprint of cities been expanding?
The population grid data only measures residential population so it cannot be used to estimate the size of the total urban footprint of cities over time, but we can use it to estimate the urban residential footprint. I’ve again used 5 persons/ha as a threshold, and here’s how the cities have growth since 2006:
Melbourne and Sydney had much the same footprint in 2006 but Melbourne has since grown significantly larger in size than Sydney, although Sydney still has a larger Capital City Statistical Area population.
The bottom half of the chart shows that Perth has had the largest percentage growth in urban residential area, followed by Brisbane then Melbourne. Sydney and Adelaide have had the least growth in footprint, and are also seeing the least population growth in percentage terms.
Animated density maps of Australian cities
Here are some animated density maps for Australia’s six largest cities from 2006 to 2022 for you to ponder.
Some things to watch for:
Limited urban sprawl and significant densification of pockets of established areas in Canberra
Much larger areas of higher density in Sydney and Melbourne
Relatively high densities in some urban growth areas in Melbourne, Brisbane, and Sydney from the late 2010s
Low density sprawl in Perth, but also densification of some inner suburban areas (along the Scarborough Beach Road and Wanneroo Road corridors, and inner suburbs like Subiaco and North Perth)
Limited urban sprawl in Adelaide, along with densification of inner suburbs
Appendix: Corrections to ABS population estimates following Census 2021
The 2021 census resulted in quite large revisions to estimated population in many cities as shown in the following chart.
Melbourne’s estimated 2021 population was revised down 2.4%, Sydney down 1.9%, while Canberra and Hobart were revised up more than 5%. To be fair to the ABS, the pandemic and border closures were unprecedented and their impacts on regional population were not easy to predict.
These corrections sum to a linear trend between 2016 and 2021 at the city level, although there was a redistribution of the estimated population within each city.
The following chart shows some detail of estimated population revisions at SA2 level for Melbourne in 2021:
The biggest reduction was in Carlton (-25% right next to University of Melbourne), and there were also reductions near other university campuses, including Kingsbury (-19%), Burwood (-14%) and Clayton (-13%). The biggest upwards revision was Fishermans Bend (+84%), and there were plenty of upwards revisions in outer urban growth areas.
And here is Sydney:
There were big reductions in Kensington (-28%, centred on UNSW), Redfern-Chippendale (-17%), many other areas near university campuses, and around the Sydney CBD.
Like Melbourne, urban growth areas on the fringe were revised upwards, including +35% in Riverstone-Marden Park.
Sydney’s public transport total patronage in March 2023 was at 79.5% of March 2019 patronage, but then April 2023 total patronage was 73.1% of April 2019 patronage. Does that mean there was a 6.4% decline in the rate of public transport use in April 2023? Actually, no, not at all.
The most common, simple, and obvious way to report public transport patronage is monthly totals. Plenty of agencies do this, but I’m here to argue that invites bad analysis and false conclusions. We can and need to do better.
Let me explain…
Not all days are the same
This is stating the obvious, but patronage generally varies by day of the week, and also between school and non-school weekdays. Here’s how it looks for Melbourne 2019 (thanks to newly published data):
The variations across Monday to Friday have increased even more post the pandemic, but that’s another story.
Not all months are the same
Obviously months are not all the same length. A month with 31 days is generally likely to have higher patronage than a month with 28 or 30 days.
Also, most months have a number of days that is not a multiple of 7 – which means that any month is going have a different mix of days of the week in any year (although three-quarters of Februarys are an exception). And we know patronage varies by individual day of the week.
Furthermore, school holidays and public holidays don’t always fall in the same months each year. In particular, Easter is sometimes in March and sometimes in April, and many jurisdictions shift school holidays to line up with Easter in each year. The end result is that the composition of each month can vary considerably between years, both in terms of days of the week and day types.
Here’s the day type make up of each month for Victoria for 2000 to 2025:
Some months are pretty consistent – May generally has 21 to 23 school weekdays. But other months vary wildly. March can have anywhere between 8 and 17 school weekdays and anywhere between 1 and 5 public holidays (counting all days of the Easter long weekend as public holidays). There are also big fluctuations in June and July, with school holidays mostly falling in July but sometimes partly or fully in June. And any given month might have 4 or 5 Saturdays and 4 or 5 Sundays (or maybe even 3 if one of them is a public holiday).
In March 2006, Victorian autumn school holidays were in March (when Melbourne hosted the Commonwealth Games) instead of the normal April, and the winter school holidays were entirely in June (normally mostly in July). This will happen again in 2026 when Victoria again hosts the Commonwealth Games.
Not all quarters are the same
If months are quite variable in composition, does aggregating to quarters reduce the issues?
In Victoria (and most Australian states), school holidays generally straddle or fall very close to the start/end of quarters. This means there is a fair amount of variability in the day type makeup of most quarters:
In Victoria, quarter 1 can have anywhere between 35 and 44 school days, and between 3 and 7 public holidays. You might also notice that a new Q3 public holiday was introduced in 2016 (Grand Final Eve in late September), and then there was a one-off extra public holiday for the Queen’s death in 2022. The number of public holidays also increases when Christmas Day falls on a Saturday or Sunday.
If you want to understand underling patronage trends, you don’t want to be led astray by these sorts of changes. Quarters are no better than months for analysing total public transport patronage.
Not all financial years are the same either
Another very common way to report patronage data – especially in annual reports – is by financial years (July – June) but they aren’t all that consistent over time either, given that school holidays can slide between June and July, like has happened in Victoria:
Hopefully you’ve got the idea that it isn’t a great idea to analyse total monthly, quarterly, or even financial year patronage if you want to assess trends over time. Yet that’s exactly the most common data you are likely to find.
Calendar years are slightly better for day type composition consistency, but in Victoria calendar years can vary between 50 and 54 school holiday weekdays. And of course every fourth year is one day longer than the others.
A better way: average daily patronage by day of the week and day type
Victoria is now publishing average daily patronage by day of the week and day type (school or non-school weekday) for each month (excluding public holidays).
This means it is possible to compile average school week patronage (being the sum of average daily Sunday, school Monday, school Tuesday, school Wednesday, school Thursday, school Friday, and Saturday patronage). An average school week patronage figure is readily calculable for all months except January (because they have few school days and variable start dates between schools make it a bit messy).
An average school week figure can be calculated regardless of shifting dates of school holidays, public holidays and the general day of the week composition of any month across years. And analysts don’t need to worry about having their own calendar of school and public holidays.
How much cleaner is average school week patronage? Victoria also publishes monthly totals, which makes it possible to compare to average school week figures, as per the following chart:
Note: This time period of course includes the COVID pandemic including lockdowns which is interesting in itself, but for the point of this post I suggest you focus on pre-pandemic years 2018 and 2019.
Monthly total patronage jumps up and down a fair bit in 2018 and 2019 (with higher totals for most 31-day months, who would have guessed?), but average school weekday patronage was relatively smooth across the year as you might expect. The average school week patronage data also shows clearly that March is the busiest month of the year. But if you looked at the monthly totals you might draw the false conclusion that days in May are generally as busy as days in March (at least for 2018).
To further illustrate the differences, the next chart compares monthly average school week patronage to total monthly patronage, for all months February 2018 to March 2023 (excluding Januarys). Each dot is a mode and a month/year, and if total monthly patronage was as good a representation of patronage as school week patronage then this would need to be a fairly thin cloud as data points.
You can see the cloud is not very thin. March and April are often outliers, as they are subject to shifting Easter and school holidays.
March 2020 is actually one of the biggest outliers – as it was also when Melbourne first went into a COVID lockdown.
Another common form of analysis in recent (pandemic) times has been to compare monthly patronage to the same month in (pre-pandemic) 2019, to get an indication of patronage recovery. The following chart shows patronage relative to 2019 using both total monthly patronage and average school week patronage for Melbourne’s public transport:
You can see the orange line (total monthly patronage) is prone to bouncing around month to month, while the blue line (average school week) generally shows a smoother trend. Someone not knowing any better might have been slightly alarmed or confused about the steep decline in total monthly patronage recovery in October 2022, whereas on the average school week measure it was only a slight drop on September 2022 (perhaps because of planned disruptions to the network?).
Total March 2023 Melbourne public transport patronage was 78.8% of the total in March 2019, but 75.3% of the March 2019 average school week patronage. The total monthly patronage approach arguably overestimates the likely underlying patronage recovery by 3.5%.
How much noise gets introduced when analysing monthly totals?
Let me introduce you to the mythical city of Predictaville. Nothing ever changes in Predictaville. There is no population growth, no behaviour change, no pandemics, no seasons, no illness. It’s very boring and entirely predictable.
Every school weekday there are exactly 440,000 public transport boardings, every school holiday weekday it is 340,000, every Saturday 195,000, Sunday 135,000, and public holiday 110,000. Remarkable round numbers, I know. It’s been like this since 2001 and all indications are that it will be like this until at least 2025.
These numbers just happen to be pretty similar to average Melbourne bus patronage in 2019, and Predictaville just happens to follow the Victorian school and public holiday calendar.
So public transport patronage growth in Predictaville is going to be exactly zero all the time, right?
That’s what you will get when measuring growth by average school weeks.
But what if you were measuring growth year on year using total monthly patronage?
According to this measure, patronage in Predictaville sometimes grows at +1.6% per annum and sometimes declines at -1.6% per annum. You might think 2012 and 2020 were growth years, while 2005, 2008 and 2021 saw declines. All misleading.
This is actually a chart indicating the sort of avoidable error introduced when you do analysis on total monthly patronage. We don’t need and shouldn’t have this sort of error in our analysis; particularly if it is going to influence policy decisions.
How is patronage data being reported in Australia and New Zealand now?
Transport for NSW publishes monthly total patronage which is likewise problematic.
They also have an interactive dashboard that effectively provides average weekday patronage, average school weekday patronage, and average weekend/public holiday daily patronage (but not average school holiday weekday patronage). Unfortunately you cannot download this data, and it doesn’t take into account that different months contain different numbers of Sundays, Mondays, Tuesdays, Wednesday, Thursdays, Fridays, and Saturdays. We know patronage varies by day of the week. Worse still, there is likely a significant difference between typical Saturday and Sunday patronage and different months might have 4 or 5 Saturdays and 4 or 5 Sundays. This means the average weekend daily patronage figures have avoidable misleading variations between months and years.
NSW have also published very detailed Opal data for selected weeks in 2016 and 2020 (only two were pre-pandemic school weeks), but no such data on an ongoing basis.
Transport Canberra reports average weekday and weekend daily boardings by quarter, but doesn’t distinguish school and non-school weekdays and bundles public holidays with weekends, which makes it very difficult to cleanly analyse growth trends. However they also publish daily data which is useful, but you need a calendar of school and public holidays.
The South Australian government reports quarterly Adelaide boardings (buried in a dataset about complaints) which is problematic as I’ve explained above. You can also get daily Metrocard validations by route (not quite the same as boardings), although exact numbers are not reported – just bands in multiples of 10, which makes it pretty much impossible to sum to estimate total daily patronage.
Translink (south east Queensland) publishes weekly passenger trip counts (to 2 decimal places!), which is slightly better than monthly, but analysts still need to have their own calendar of school holidays or public holidays to make sense of variations week to week. And at the time of writing data unfortunately hadn’t been updated since October 2022.
Auckland publishes monthly and daily patronage figures which is very handy. The daily data allows you to construct average school week patronage, but you need a calendar of school and public holidays.
So my plea to all agencies is to consider publishing average daily patronage by day type and day of the week, as Victoria now does. This will enable external analysts to do cleaner patronage analysis with much less effort. Perhaps an organisation like BITRE could even compile a national database of such data.
Even better would be for agencies to also publish daily patronage estimates, along with a day type calendar including school and public holidays, which would enable analysts to do even more with the data.
Can we do even better for patronage reporting and analysis?
Average patronage by day of the week and day type avoids much of the misleading variations in total monthly patronage data, helping us to better understand underlying trends.
But there will still be other smaller sources of misleading variations and you could definitely take this further, for example:
Filter out Mondays next to a Tuesday public holiday and Fridays next to a Thursday public holiday, as these are popular days for workers to take leave to create a long weekend.
Likewise, filter out weeks with more two or more public holidays falling within Monday to Friday – which are also popular times to generate longer holidays with fewer annual leave days.
Filter out the first / last weeks of the school year if some schools follow a slightly different calendar (particularly in New Zealand). I discarded January above partly for this reason. All Decembers (in Australia at least) will also be impacted by senior students finishing school earlier, but the impact might vary year to year.
Filter only for weeks where both school and most universities are teaching (although that leaves you with only about six months of the year, plus not all universities follow the same academic calendar).
Filter out any days with free travel or large-scale disruptions (planned or unplanned). For example, free travel is usually offered on New Year’s Eve and Christmas Day in Victoria. And Sydney had several free travel days following major unplanned disruptions in 2022.
Filter out Saturdays and Sundays on long weekends and during school holidays, which are probably more likely to be impacted by larger scale planned disruptions.
I mentioned at the start of this post that variations in Sydney monthly total patronage recovery figures were misleading, and hopefully you now understand why. In an upcoming post I’ll estimate underlying patronage recovery across big cities in Australia and New Zealand, and explain why I think actual underlying patronage recovery in Sydney didn’t change so much between March and April 2023.
With the COVID19 pandemic seemingly behind us, what has been happening to public transport patronage? Has it recovered to 2019 levels? In which cities is public transport patronage recovering the strongest?
This post provides my best estimates of how much public transport patronage has recovered in major Australian and New Zealand cities.
In my last post I talked about the problems when transit agencies only publish monthly total patronage (or weekly or quarterly totals). For those cities that don’t publish more useful data, I’ve used what I think is a reasonable methodology to try to adjust those figures to take into account calendar effects.
Unlike most of my posts, I’ll present the findings first then explain how I got them (because I reckon a good portion of even this blog’s readers might be less interested in the methodology).
Estimates of typical school week public transport patronage recovery
Here’s a chart comparing estimated typical school week patronage per month to the same month in 2019 (the year before the COVID19 pandemic) where clean data is available. My confidence levels around estimates for each city is discussed further below.
Technical notes: Sydney+ refers to the Opal ticketing region that includes Greater Sydney, Newcastle/Hunter, Blue Mountains, and the Illawarra.Typical school week patronage is the sum of the median patronage for each day of the week (where available), otherwise an estimate of average school week patronage. More explanation below.
Perth has been at or near the top of patronage recovery for most recent months, perhaps partly boosted by a new rail line opening to the airport and High Wycombe in October 2022.
Wellington – which I suspect is an unsung public transport powerhouse – is in second place at 90%, whilst all other cities are between 75% and 83%.
Looking at the 2023 data, most cities appear to be relatively flat in their patronage recovery (except Perth and Wellington), which might suggest that travel patterns have settled following the pandemic (including a share of office workers working remotely some days per week).
How does patronage recovery compare to population growth?
I’ve calculated the change in population for each city since June 2019. For South East Queensland I’ve used an approximation of the Translink service area, and for “Sydney+” I’ve used an approximation of the Opal fare region covering Sydney and surrounds. At the time of writing, population estimates were only available until June 2022.
There are significant differences between the cities.
So how does public transport patronage recovery compare to population change? The following chart shows June 2022 patronage and population as a proportion of June 2019 levels:
The changes in population are much smaller than the changes in patronage and I have deliberately used a similar scale on each axis to illustrate this. Population growth certainly does not explain most of the variation in patronage recovery, but it is very likely to be a factor.
Perth had the highest patronage recovery in June 2022, but only some of this could be attributed to high population growth. Wellington had little population growth but the second highest patronage recovery to June 2022.
Perth might have the highest patronage recovery rate overall because it spent the least amount of time under lockdown, and so commuters had less time getting used to working at home. Melbourne, Sydney, Canberra, and Auckland spent the longest periods under lockdown, and – with the exception of Canberra – seem to be tracking at the bottom end of the patronage recovery ratings, which might reflect their workers becoming more comfortable with working from home during the pandemic. However I’m just speculating.
How has patronage recovery varied by day type?
Here’s patronage recovery for school weekdays (for cities which publish weekday data):
Note: Canberra estimates are only available for July to December because daily patronage data has unfortunately not been published for January to June 2019.
And here is the same for weekends (again for the same four cities that publish weekend data):
Weekend patronage is a bit more volatile as weekends typically have varying levels of major events and planned service disruptions. Most months also only have 8 weekend days, so a couple of unusual days can skew the month average and create “noise” in the data.
However all cities have been above 90% patronage recovery on weekends. Weekend patronage has returned more strongly than weekday patronage, probably because new remote working patterns only significantly impact weekdays.
How has patronage recovery varied between cities by mode?
I’m only confident about predicting modal patronage in cities that report daily or average day type patronage by mode, as the day type weightings used from another city might not apply equally to all modes.
Here is school weekday train patronage recovery for Sydney, Melbourne, and Auckland:
Auckland is slightly below Sydney and Melbourne, and recovery rates are lower than public transport overall. I suspect this may be due to train networks having a significant role in CBD commuting – a travel market most impacted by remote working.
And here is the data for weekends:
Curiously there is a lot more variation between cities. There’s also a lot more variation between months, which could well be related to the “noise” of occasional planned service disruptions and major events.
Here is average school day bus patronage for four cities where data is available:
Bus patronage recovery is lowest in Sydney, perhaps because buses play a more significant role in Sydney CBD commuter travel which will be impacted by working from home (Melbourne’s bus services are mostly not focussed on the CBD). However buses also play a major role in public transport travel to the CBDs of Auckland and Canberra, although with probably lower public transport mode shares (unfortunately it doesn’t seem possible to get public transport mode share for the Auckland CBD from 2018 NZ Census data).
And for completeness, here is a chart for weekend bus patronage:
Weekend bus patronage recovery is higher than weekdays, and higher than weekend train patronage recovery, in all cities. Reported weekend bus patronage in Canberra, Melbourne, and Auckland has exceeded 2019 level in recent months.
How good are these estimates?
Some agencies publish very useful data such as daily patronage or day type average patronage, while others only publish monthly or quarterly totals which is much less useful for trend analysis. Here’s a summary of how I estimated time-series patronage and therefore patronage recovery in each city (which I will explain below).
South East Queensland (Translink) – including Brisbane, Gold Coast, Sunshine Coast
Reported weekly totals, aggregated to months, and adjusted by day type weightings calculated for Melbourne 2022.
Lower
Adelaide
Reported quarterly totals, adjusted by day type weightings calculated for Auckland 2022.
Lower
Perth
Reported monthly totals, adjusted by day type weightings calculated for Auckland 2022.
Lower
Canberra
Reported daily patronage (from July 2019) and monthly total patronage for May and June 2019 adjusted by day type weightings calculated for Canberra 2022 (weekdays) and 2019 (weekends and public holidays). Data pre-May 2019 has been excluded as there was a step change in boardings when a new network was implemented in late April 2019. May 2019 has been included however I should note it had unusually high boardings.
Moderate
Auckland
Reported daily patronage (up to 23 July 2023 at the time of writing).
High
Wellington
Reported monthly totals, adjusted by day type weightings calculated for Auckland 2022.
Lower
For Melbourne and Auckland excellent data is published that allows calculation of typical school week patronage for February to December, which gives me high confidence in the estimates. Canberra has published daily patronage data but only from July 2019 so I’ve had to estimate school week patronage for May and June 2019 from monthly totals (process described below).
You’ll notice I’ve referred to “typical” patronage rather than average patronage. For cities with daily data, I’ve summed the median patronage of each relevant day of the week, rather than taking a simple average of days of that day type in the month. Taking the median can help remove outlier days, and summing over the days of the week means I’m weighting each day of the week equally, regardless of how many occurrences there are in a month (eg a month with 5 Sundays and 4 Saturdays). For Melbourne I’ve only got the average patronage per day of the week, but I’m still summing one value of each day of the week.
Transport for NSW have an interactive dashboard from which you can manually transcribe (but not copy or download) the average school weekday patronage and average weekend daily patronage for each mode and each month. I’ve compiled a typical school week estimate using 5 times the average school weekday plus 2 times the average weekend day. This is likely pretty close to what true average school week patronage is (more discussion below).
But what about the other cities?
How can you estimate patronage trends in cities where only monthly, quarterly, or weekly total patronage data is available?
Rather than simply calculating percentage patronage recovery on monthly totals (which has all the issues I explained in my previous post), I’ve made an attempt to compensate for the day type composition of each month in each city.
Basically this method involves calculating a weighting for each month, based on the day type composition of each month. If you divide total monthly patronage by the sum of weightings for all days of each month you can get a school weekday equivalent figure on which you can do time series analysis.
This requires a calendar of day types, and assumptions around the relative patronage weightings of each day type.
Technical note: In New Zealand it seems schools generally are able to vary their start and end of year by up to 5 regular weekdays. I’ve excluded these 10 weekdays from many calculations because they do not represent clean school or school holiday weekdays. For December 2019 I have also excluded two weeks for Auckland due to unusually low reported patronage due to bus driver industrial action.
The assumed day type weightings need to come from another city, on the hope that they will be similar to the true value. But which city, and measured in what year?
I’ve calculated the relative patronage weights of each day type for Melbourne, Canberra, Auckland, plus one school week sample from February 2020 for Sydney+ (Opal region). These are indexed to a school Monday being 1.
Note: no data is available for public holidays in Melbourne, and the Sydney data does not include school holiday weekdays or public holidays.
Melbourne, Canberra, and Auckland weightings are pretty similar across days of the week for school days, but Melbourne’s school holiday weekdays and weekends were relatively busier than both Auckland and Canberra. The Canberra school holiday figures are highly variable between weekdays and are only available for the second half of 2019 (so are impacted more significantly by the timing of Christmas).
The data suggests the big cities of Sydney and Melbourne attract much more weekend patronage compared to the smaller cities. They also have higher public transport mode shares – refer Update on Australian transport trends (December 2022) for comparisons between Australia cities. In terms of public transport share of journeys to work, Auckland was at around 14% in 2018, while Melbourne was 18.2% in 2016). This suggest Melbourne day type weightings might be suitable for larger cities while Auckland day type weightings might be suitable for smaller cities.
The next question is: which year’s weightings should be used? The chart above showed day type weightings from pre-pandemic times, but it turns out they have changed a bit since the pandemic. Here are 2022 day type weightings:
In all cities in 2022 there is a lot more variation across Monday to Friday school days (Mondays and Fridays being popular remote working days) and school holiday weekdays are much more similar between Melbourne and Auckland, while weekends remain quite different.
In fact here’s how the cities with available data compare for ratios between weekends and school weekdays in 2019 and 2022:
The ratios increased in all cities between 2019 and 2022 except Canberra. The 2019 ratios are remarkably close between Melbourne and Sydney, but the 2022 data shows a higher weighting for weekends in Melbourne than Sydney. The Auckland and Canberra ratios are substantially lower in both years. The ratio went down in Canberra in 2022 possibly due to issues obtaining enough drivers to run weekend timetables in that city.
So what day type weightings should we use for each city?
Should we use Melbourne, Auckland, or Canberra weightings, and from what year should we derive these weightings? And how worried should we be about getting these weightings right?
Well, Auckland provides us with daily patronage data for a “medium sized” city, which allows us to compare calculated typical school week patronage, and also allows calculations as if only more summary data was available (as per other cities). However we need to exclude both January and December, as there were no normal school weekdays in those months in 2019.
The red line (total monthly patronage with no calendar effect adjustments) has the most fluctuations month to month and I’m pretty confident this is misleading for all the reasons mentioned in my last post.
Most of the other methodologies produce a figure fairly close to the best estimate (teal line), except in 2021 and 2023.
The green line (compiled 5 x average school day + 2 x average weekend day) is mostly within 2% of the (arguably) best estimate, but there are variations that will be explained by the green line not taking into account the day of the week composition of the month, nor excluding outlier busy/quiet days (unlike medians). So if you only have average school weekday and average weekend day data you’re not going to be too far off the best estimate. That gives me “moderate” confidence to use Sydney’s average school weekday and average weekend day patronage data to estimate patronage recovery.
But what if you only have total monthly patronage and have to use day type weightings? It’s a bit hard to see the differences in the above chart, so here’s a zoom in for 2022 and 2023:
There’s not a lot of difference between the 2019 and 2022 day type weightings, and notably both methods underestimate patronage recovery for most months of 2023, which is not ideal. Note: February 2023 had several days of significant disruptions due to major flooding events which impacted most measures (except the “typical school week” measure that uses medians to reduce the impact of outliers).
Sydney also provides data that allows us to compare day type weighting estimates to the probably quite good compiled school week estimate (based on 5 average school weekdays and 2 average weekend days). The next chart includes estimates of Sydney patronage recovery using day type weightings from Melbourne and Auckland for different years:
Technical note: I have assumed Melbourne public holidays have the same day type weighting as Sundays, for want of more published data.
The estimates are mostly pretty close, but let’s zoom into recent months to see the differences between the methodologies more clearly:
The closest estimate to the compiled average school week data is using Melbourne 2022 day type weightings to adjust monthly totals (the difference is up to 0.9% in April 2023). This suggests Melbourne is probably the best city from which to source day type weightings to apply to Sydney (both large cities), and 2022 (a post-pandemic year) might be a better source year for these weightings. That’s consistent with Sydney having similar ratios of weekday to weekend patronage as Melbourne.
You can see the red line (a simple total monthly patronage comparison) is again often the biggest outlier, which is what happens when you don’t control for calendar effects. I mentioned at the start of my last post that the raw monthly totals suggested a misleadingly large 6.4% drop in patronage recovery from 79.5% in March 2023 to 73.1% in April 2023. On the average school week estimates, patronage recovery dropped only 1.8% from 77.2% to 75.6%.
So which city’s day type weightings are most appropriate for the smaller cities of Perth, Adelaide, Wellington, and Brisbane that don’t currently publish day type patronage? Does it even make a lot of difference?
Well here are patronage recovery estimates for Adelaide, Brisbane, Wellington, and Perth using both Melbourne and Auckland day type weightings from 2022.
Most of the estimates are within 1%, although there are some larger variances for Wellington and Perth.
The Wellington recovery line is smoother for Melbourne weightings in 2021, but smoother with Auckland weightings in 2022 and 2023 (so far). The Wellington estimates can differ by up to 2% and a smoother trend line may or may not mean that one source city for day type weightings is better than the other.
The fact that Melbourne day weightings worked better than Auckland day weightings when it came to Sydney suggests that larger city weightings might be appropriate for other large cities, and perhaps smaller city weightings might be appropriate for other smaller cities.
I have adopted Melbourne day type weightings for South East Queensland, and Auckland day type weightings for Adelaide, Perth, and Wellington, on the principle that larger cities are likely to have relatively higher public transport patronage on weekends (compared to weekdays). Of course I would really rather prefer to not have make assumptions.
That was pretty complicated and involved – is there a lazy option?
Okay, so if you don’t have – or want to compile – calendar data and/or you don’t want to use day type weightings from another city, you can still compile rolling 12 month patronage totals and compare those year-on-year to estimate patronage growth.
The worst times of year at which to measure year-on-year patronage growth are probably at the end of March, June, September, and December (because of when school holidays fall). Of course being quarter ends, these are also probably the most common times it is measured!
It’s slightly better to measure year on year growth for 12 month periods ending with February, May, August, and/or November, as years ending in these months will contain four complete sets of school holidays, and exactly one Easter (at least for countries with similar school terms to Australia and New Zealand). However there will still be errors because of variations in day type composition of those 12 month periods.
In my last post I introduced the mythical city of Predictaville, where public transport patronage is perfectly constant by day type and they follow Victorian school and public holidays. Here is what Predictaville patronage growth would look like measured year on year at end of November each year:
Calculated growth ranges between +0.8% and -0.9%, which is about half as bad as +1.6% to -1.6% when measured at other month ends, but still not ideal (the true value is zero). The errors in the real world will depend on the relative mix of patronage between day types (Predictaville patronage per day type was modelled on Melbourne’s buses).
That’s a not-too-terrible option for patronage growth, but if you are interested in patronage recovery versus 2019 on a monthly basis, I’m not sure there is any reasonable lazy option.
Let’s hope the usefulness of published patronage data improves soon so complicated assumptions-based calendar adjustments and problematic lazy calculation options can be avoided!
Where do workers have the longest travel distance to work? What workplace locations have workers that live far away? How far are commuters in new urban greenfield areas from their workplaces? How do distances to work vary by gender? Where is a lack of local jobs leading to longer commute distances? Where are Victoria’s commuter towns?
This post explores ABS census data on the on-road distances between homes and workplaces around Melbourne and Victoria (a future post may cover other parts of Australia).
See the appendix at the end of this post for more details on the data and calculations.
Melbourne and surrounds
Here are median on-road distances to work around Melbourne for 2021:
Technical note: I’ve filtered for SA1s with 2+ persons aged 15+ per hectare to focus on relatively urban areas.
The shortest median distances in 2021 were around the central city. Longer distance were seen in the outer suburbs with the longest distances on the urban fringe – particularly Manor Lakes, Werribee West, and Pakenham, the “satellite” urban areas of Melton, Sunbury, and Eynesbury, and in some hills towns between Belgrave and Gembrook in the east. This makes sense as outer suburban area are generally further away from jobs.
Urban fringe growth areas
The following map shows the typical distances to work from greenfields areas on the western and northern urban fringe of Melbourne.
You might want to click/tap on this one to make the labels easier to read.
And here are the south-east urban growth areas:
Technical notes: I’ve filtered for brand new SA1s (in 2021) on the urban fringe where the containing SA2 has had population growth of 1000+ people between 2016 and 2021 (consistent with previous analysis of urban fringe areas on this blog). I’ve then aggregated to a median distance to work for each SA2 (being the median of the new SA1 medians).Labels are mostly SA2 names but I’ve renamed some for clarity.
Different growth fronts have very different median distances to work. For example, median distances to work from Manor Lakes were almost double those of Truganina, Wollert, Roxburgh Park, and Cranbourne.
How did distance to work relate to distance to Melbourne?
Here’s a scatter plot comparing home distances from the Melbourne CBD and median distances to work at SA1 geography (using same urban filter as above):
There’s a bit going on here. In areas very close to the Melbourne CBD, median distances to work increase pretty much linearly with distance from the CBD, suggesting these areas are probably fairly dependent on central Melbourne for employment. Then things start to spread out a bit as you get further from the city, with some median distances to work being largely proportional to distance from the CBD, while many other areas have median distances to work of 10-15km. The linear trend fades away as you get further from Melbourne.
A series of orange dots form a “V” shape either side of 65km from the CBD – these are in the Geelong SA4 area, and central Geelong is around 65 km from Melbourne (straight-line distance). This suggests median distances to work in the Geelong region are largely proportional to distance from central Geelong.
The chart is a bit messy with lots of overlapping dots so let’s simplify things by aggregating to SA2s. For each SA2 I’ve calculated the median straight-line distance to the CBD (of centroids of the SA1s in the SA2), and the weighted average of the median on-road distances to work of the SA1s in the SA2 (weighted by number of workers in each SA1):
You can see more clearly that in Melbourne’s west and north west the median distance to work is roughly proportional to the distance from the CBD, while in Melbourne’s outer east and south east, the median distance doesn’t rise as much with increasing distance from the CBD – suggesting these areas are less dependent on central city jobs with more people working locally.
Melbourne’s commuter towns
The top-right of the above chart shows towns remote from the main Melbourne urbanised area including Bacchus March, Kilmore, Riddells Creek, Gisborne, Kinglake, Eynesbury, Wallan, Melton, Lancefield, Ballan, Kilmore, Romsey, and Woodend. These all have a long median distance to work, suggesting they are fairly dependent on Melbourne for employment.
So let’s go back to the map and focus on towns to the north-west of Melbourne:
Firstly, the regional cities of Ballarat, and Bendigo have quite low median distances to work – suggesting the “median worker” is working locally.
Closer to Melbourne are what you might call commuter towns that I listed above. Basically, at least half of the workers in these towns worked way out of town, the median distance to work not dissimilar to the town’s distance from central Melbourne. Most of these towns have a relatively fast and frequent train service to the Melbourne CBD, which no doubt helps facilitates some such long commutes.
These commuter towns only spread so far out, likely reflecting a limit to how far (or how long) people are prepared to commute. While in most parts of Woodend the “median” worker was a long distance commuter, the median worker in Kyneton (the next town down the line) appears to have worked locally. Broadford was more a mix. The limit appears to be around 70 km straight-line distance from Melbourne’s CBD.
Similarly south east of Melbourne, the small towns of Garfield, Bunyip, Longwarry, Koo Wee Rup and Lang Lang had long median distances to work, but then then Korumburra, Drouin, and Warragul mostly had short median distances, as shown in the following map:
Okay so the median worker is doing a long commute in these towns, but do those distances drop away at lower percentiles? Below is a map showing the 25th percentile distance to work. The commuter towns still have very long distances (although Woodend is now a mix and Broadford comes in around 20 km):
In the mostly red towns, over three-quarters of workers had workplaces a long distance out of town (although of course many may work some or all of their hours from home / remote from their workplace, particularly in the post-pandemic world).
But were these towns actually dependent on central Melbourne jobs?
How dependent are different areas on Melbourne CBD employment?
The next map shows the percentage of workers in each SA2 with a workplace in central Melbourne (defined by a set of SA2s, refer chart).
Technical note: I’ve capped the top end of the colour scale at 40% but the central city itself was higher.
The proportion of workers working in central Melbourne generally declined with distance from the CBD, with relative anomalies in Melbourne’s south west, along the Bendigo rail corridor to the north-west, and in coastal areas south of Melbourne.
The commuter town with the highest share of central Melbourne workers was Woodend at just 14%. This suggests these commuter towns are not so much dependent on central Melbourne, but broader Melbourne for employment, which means a lot of long car journeys to work.
In fact, here is a similar map showing the proportion of workers who worked in Greater Melbourne statistical area:
All home SA2s that are within Greater Melbourne show us as a shade of green (over 60%) – as the many local workers in these SA2s will be classed as working in Greater Melbourne.
The Woodend SA2 comes in with 48% of workers working within Greater Melbourne, which means 34% of Woodend workers had a workplace in Greater Melbourne but outside the central city. In fact around 235 of them worked in nearby Gisborne, Romsey, and Macedon which are included within Greater Melbourne.
Greater Melbourne accounted for 14% of Geelong workers, 6% of Ballarat workers, and just 2% of Bendigo workers. The Lorne-Anglesea SA2 is a relatively anomaly, with 24% of workers working in Greater Melbourne (I wonder if it contained some people working remotely from holiday homes who considered their holiday home to be their “usual residence” at the time of the census, which was a time of COVID lockdown in Melbourne).
You might be wondering why many distances to work were almost directly proportional to the distances to Melbourne for commuter towns, but that only a small proportion worked in central Melbourne. This can be explained in that the distances to work are measured on-road, while I’ve calculated straight-line distances to central Melbourne. The ABS says that on-road distances are typically 30% longer than straight line distances. When I look at origin-destination data I see that many of these workers worked on their home side of the Melbourne CBD.
What about the rest of Victoria?
If we expand the SA2 scatter plot out to include the whole state it looks like this (you might need to click/tap to enlarge to read the labels):
The diagonal pattern at the left of the chart burns out with Kinglake and Bacchus Marsh surrounds (around 70 km from the Melbourne CBD). Most further out towns are along the bottom of the chart – i.e. the median distance to work is very short, probably to a workplace in that town.
However there are some SA2s remote from Melbourne that have relatively long median commuter distances. I’ve looked at the home SA2 to work SA2 volume data and confirmed several are towns (or SA2s) that are within the catchment of a much larger nearby town (or set of towns), as per the table below (which is not exhaustive). They are in effect commuter towns for nearby larger towns.
Inspired by the Gender Equality Toolkit In Transport (with the wonderful acronym GET-IT), I’m going to make more effort to disaggregate transport data by gender (where possible) on this blog. Unfortunately the ABS only provides 2021 census data for binary sex categories, so this will restrict the analysis that can be undertaken.
I’ve calculated the median distance to work by sex for every SA1, but unfortunately it is more susceptible to issues around small counts being randomly adjusted. ABS’s TableBuilder never reports counts of 1 or 2 and this might impact the median distance calculation in SA1s with a smaller number of workers of a sex (particularly women). So there may be some noise in the calculations.
Here’s a side by side comparison of median distance to work around Melbourne (you will probably want to click/tap this to expand):
Both male and female workers show a trend to longer distances in the outer suburbs of Melbourne, but a bit less so for female workers. Indeed the outer suburban areas of Melton, Bacchus March, Sunbury, Wyndham, and Pakenham show a more speckled pattern for female workers, with some SA1s having short median distances and other long median distances.
This variation (or noise) is more evident when I plot the ratio of male to female median distances to work:
In many outer suburban areas (both recent growth and more established) there are SA1s where the male median distance to work is two or three times longer than the female median.
To reduce the noise a bit, I’ve aggregated median distances at SA2 geography (using a weighted average of SA1 median distances), and plotted this against distance from central Melbourne:
The weighted average ratio (grey line) was just above 1 in the central city, and then increased to around 1.2 to 1.3 in the middle suburbs, then grew to almost 1.4 in the outer suburbs and commuter towns. But as you can see there is significant variation between SA2s, and I’ve labelled as many SA2s as possible on the chart. I notice many relatively wealthy areas at the top of the chart, while the bottom of the chart contains many more disadvantaged areas.
Where was there a job / worker imbalance?
We can calculate the ratio of workers to jobs in a region to understand if there is a surplus of workers or jobs. However it is important to keep in mind that around 5% of workers do not have a fixed workplace and will be excluded from the count of jobs, so the average ratio will be around 0.95.
I have done this analysis at SA3 geography as I think SA2s are too small (some include employment areas and many do not) and SA4s are a bit too big.
This chart shows the ratio of workers to jobs for SA3s around Melbourne:
Technical note: this analysis counts only employed persons. You could repeat this analysis including looking for work to understand access (or lack thereof) to opportunities, but that’s another issue.
As you’d expect there was a big surplus of jobs relative to workers in the central city, with many people commuting into the City of Melbourne. There was also a surplus of jobs in SA3s that contain major employment areas, including Monash, Dandenong, Keilor, and Tullamarine – Broadmeadows (which includes Melbourne Airport).
The grey areas were pretty well balanced including Kingston, Stonnington, and Geelong. Box Hill and Maribyrnong were just below 1.
The orange areas had a large surplus of workers compared to jobs. This generally leads to longer commutes, although a neighbouring region with a surplus of jobs might mean these commutes are not very long. The biggest worker surpluses around Melbourne were in the SA3s of Casey – South, and Manningham – East, Sunbury, and Nillumbik – Kinglake. These areas generally had the longest median commutes as we saw above.
Wyndham and Melton – Bacchus Marsh SA3s in Melbourne’s outer west had slightly higher ratios but they were also a long way from SA3s with surpluses – you needed to travel to Keilor, central Melbourne or Port Melbourne to find an SA3 with a surplus, so this explains the long median distances to work. By comparison, in the outer south-east of Melbourne the Casey – South SA3 had a low ratio but is adjacent to Dandenong which had a surplus of jobs.
What about the worker : job balance in regional Victoria?
There was an even balance of workers and jobs in the major regional cities of Ballarat, Bendigo, Shepparton, and the Latrobe Valley. In rural areas further away from Melbourne the ratios were 0.9 or 1.
Commute distances by work location
We can also do distance to work analysis for workplace locations. Here are median commute distances by workplace locations around Melbourne:
The longest median commutes were to jobs in:
West Melbourne and the Port of Melbourne
Fishermans Bend
Melbourne Airport
a pocket of Werribee South including the Werribee Open Range Zoo
some industrial areas in the west
the Police Academy in Glen Waverley
a pocket of Lalor – West that includes the Melbourne Wholesale Fruit and Vegetable Market which was relocated from West Melbourne in 2015.
Many of these areas contain blue collar jobs where employees perhaps cannot readily afford to live in nearby housing, and/or there was no immediately adjacent housing areas because of land use segregation.
Then in a lot of residential areas the median distances were relatively short – most jobs being filled by relatively local residents.
Here’s a closeup of central Melbourne:
Most of the CBD had median distances of between 11 and 17 km, while Docklands was mostly a bit longer – between 15 and 22 km (I’m not sure I have a good explanation for that difference).
Curiously the zones around North Melbourne Station, Flinders Street Station, and Southern Cross Station had very long median distances – perhaps including train drivers with a notional workplace address of a central station or train yard who might actually start their day at a stabling yard in the suburbs?
There’s also a block on the corner of La Trobe Street and Spring Street with a 23 km median distance. In 2021 the dominant industries of employment for this block were construction and telecommunications services (with a total of only 376 employees).
I’ve examined data for peri-urban and regional employment areas. Most had median commute distances below 15 km with the exceptions of:
Pakenham South West 23km (which is on the edge of the Melbourne metropolitan area)
Broadford 17 km (which includes the Mitchell Shire Council offices and a major Nestle factory)
Parts of Corio 17 km (which is on the northern edge of Geelong)
Tatura 16 km (which might be attracting workers from Shepparton, Mooroopna, and Kyabram)
And for anyone interested, regional areas with relatively long 75th percentile commuter distances were:
Warracknabeal 39 km
Castlemaine 38 km
Broadford 39 km
Daylesford 37k
Seymour 37 km
Kyneton 35 km
Beechworth 31 km
Warragul South 32 km
Wonthaggi 31 km
I hope you’ve found this interesting. In future posts I hope to compare Melbourne to other Australian cities, and look at how distances vary by industry of employment.
Appendix: estimating percentile distances to work
Distance to work is estimated by the ABS looking at the mesh block location of the persons usual residence and workplace address and calculating the shortest on-road distance between these locations. Where a worker does not have a fixed workplace address there is no calculation (about 5% of workers).
The ABS don’t publish the actual distance to work for every worker (that would be too much data and could breach privacy) but workers are banded into distance intervals that are 0.5 km wide up to 3 km, then 1 km wide up to 30 km, then 2km wide up to 80 km, then 5 km wide up to 100 km, and so on.
I’ve extracted a count of employees in each of these intervals, and then looked up the intervals either side of the 25th, 50th, and 75th percentile worker. I’ve then used a straight line interpolation between the middle distance of the interval below the percentile and the middle distance of the interval above the percentile to estimate the median distance to work. It’s not perfect but I reckon it would be pretty close to the true value, and the maps show a fairly smooth pattern across the city (except sometimes when disaggregated by sex).
What’s the latest data telling us about transport trends in Australia?
The Australian Bureau of Infrastructure and Transport Research Economics (BITRE) have recently published their annual yearbook full of numbers, and this post aims to turn those (plus several other data sources) into information and insights about the latest trends in Australian transport.
This is a long and comprehensive post (67 charts) covering:
I’ve been putting out similar posts in past years, and commentary in this post will mostly be around recent year trends. See other similar posts for a little more discussion around historical trends (December 2022, January 2022, December 2020, December 2019, December 2018).
Vehicle kilometres travelled
Vehicle and passenger kilometre figures were significantly impacted by COVID lockdowns in 2020 and 2021 which has impacted financial years 2019-20, 2020-21, and 2021-22. Data is now available for 2022-23, the first post-pandemic year without lock downs.
Total vehicle kilometres for 2022-23 bounced back but were still lower than 2018-19:
The biggest pandemic-related declines in vehicle kilometres were in cars, motorcycles, and buses:
All modes showed strong growth in 2022-23.
Here’s the view on a per-capita basis:
Vehicle kilometres per capita peaked around 2004-05 and were starting to flatline in some states before the pandemic hit with obvious impacts. In 2022-23 vehicle kilometres per capita increased in all states and territories except the Northern Territory and Tasmania.
Here is the same data for capital cities. Note that ABS estimates of capital city population are published with more delay and at the time of writing estimates for June 2023 were not yet available. So city per capita charts in this post will only go up to financial year 2021-22 – a financial year impacted by COVID (Canberra is an exception as it has the same population as the ACT).
Canberra has dramatically reduced vehicle kilometres per capita since around 2014 leaving Brisbane as the top city.
Passenger kilometres travelled
Here are passenger kilometres travelled overall (log scale):
The pandemic had the biggest impact on rail, bus, and aviation passenger kilometres. Aviation has bounced back to pre-COVID levels while train and bus are still down (probably due to working from home patterns, reduced total bus vehicle kilometres, amongst other reasons).
Here is the same on a per-capita basis which shows very similar patterns (also a log scale):
Car passenger kilometres per capita have reduced from a peak of 13,113 in 2004 to 10,152 in 2023.
Curiously aviation passenger kilometres per capita peaked in 2014, well before the pandemic. Rail passenger kilometres per capita in 2019 were at the highest level since 1975.
Here’s total car passenger kilometres for cities:
The COVID19 pandemic certainly caused some fluctuations in car passenger volumes in all cities for 2019-20 to 2021-22. In 2022-23, Sydney and Melbourne had not recovered to pre-pandemic levels, while Perth hit a new high.
Here are per capita values for cities (up to 2021-22):
We don’t have a clean post-lockdowns year yet, but the trends in total car passenger kilometres will give some indication as to the likely trends in per capita kilometres – i.e. a likely increase
Public transport patronage
BITRE are now reporting estimates of public transport passenger trips (as well as estimated passenger kilometres). From experience, I know that estimating and reporting public transport patronage is a minefield especially for boardings that don’t generate ticketing transactions. While there are not many explanatory notes for this data, it appears BITRE have estimated capital city passenger boardings, which will be less than some ticketing region boardings (Sydney’s Opal ticketing region extends to the Illawarra and Hunter, and South East Queensland’s Go Card network includes Brisbane plus the Sunshine and Gold Coasts). I’ll report them as-is, but bear in mind that they might not be perfectly directly comparable between cities.
Of course bigger cities tend to generate more boardings, so it’s probably worth looking at passenger trips per capita per year (only available to 2021-22 for most cities):
This chart produces some unexpected outliers. Hobart shows up with very high public transport trips per capita in the 1970s, which might be relate to the Tasman Bridge Disaster which severed the bridge between 1975 and 1977 and resulted in significant ferry traffic for a few years (over 7 millions trips in 1976-77). Canberra also shows up with remarkably high trips per capita in the 1980s for a relatively small, low density, car-friendly city, but has been in steady decline since.
Canberra, Sydney, and Brisbane were seeing rising patronage per capita up to June 2019, just before the pandemic hit.
There are further reasons why comparing cities is still not straight forward. Smaller cities such as Darwin, Canberra, and Hobart are almost entirely served by buses, and so most public transport journeys will only require a single boarding. Larger cities have multiple modes and often grid networks that necessitate transfers between services for many journeys, so there will be a higher boardings to journeys ratio. If a city fundamentally transforms its network design there could be a sudden change in boardings that doesn’t reflect a change in mode share.
Indeed, here is the relationship between population and boardings over time. I’ve drawn a trend curve to the pre-pandemic data points only (up to 2019).
Larger cities are generally more conducive to high public transport mode share (for various reasons discussed elsewhere on this blog) but also often require transfers to facilitate even radial journeys.
So boardings per capita is not a clean objective measure of transit system performance. I would much prefer to be measuring public transport passenger journeys per capita (as opposed to boardings) which might overcome the limitations of some cities requiring transfers and others not.
The BITRE data is reported as “trips”, but comparing with other sources it appears the figures are boardings rather than journeys. Most agencies unfortunately don’t report public transport journeys at this time, however boardings to journeys ratio could be estimated from household travel survey data for some cities.
Public transport post-pandemic patronage recovery
I’ve been estimating public transport patronage recovery using the best available data for each city (as published by state governments – unfortunately the usefulness and resolution of data provided varies significantly, refer: We need to do better at reporting and analysing public transport patronage). This data provides a more detailed and recent estimate of patronage recovery compared to 2019 levels. Here’s the latest estimates at the time of preparing this post:
It’s possible to calculate “mass transit” mode share using the passenger kilometres estimates from BITRE (note: I use “mass transit” as BITRE do not differentiate between public and private bus travel):
Mass transit mode shares obviously took a dive during the pandemic, but have since risen, although not back to 2019 levels – presumably at least partly because of working from home.
The relative estimates of share of motorised passenger kilometres are quite different to the estimates of passengers trips per capita we saw just above. Canberra is much lower than the other cities, and Brisbane and Melbourne are closer together. The passenger kilometre estimates rely on data around average trip lengths (which is probably not regularly measured in detail in all cities), while the passenger boardings per capita figures are subject to varying transfer rates between cities. Neither are perfect.
So what else is there? I have been looking at household travel survey data to also calculate public transport mode share, but I am getting unexpected results that are quite different to BITRE estimates (especially Melbourne) and with unexpected trends over time (especially Brisbane), so I’m not comfortable to publish such analysis at this point.
What would be excellent is if agencies published counts of passenger journeys (that might involve multiple boardings), so we could compare cities more readily.
Rail Passenger travel
Here’s a chart showing estimates of annual train passenger kilometres and trips.
All cities are bouncing back after the pandemic.
Note there are some variances between the ranking of the cities – particularly Perth and Brisbane (BITRE have average train trip length in Brisbane at around 20.3 km while Perth is 16.3 km).
Here’s rail passenger kilometres per capita, but only up to 2021-22:
As mentioned earlier, city level population estimates are not yet available for 2022-23 so bounce-backs are not yet evident in per capita charts for cities.
Bus passenger travel
Here’s estimates of total bus travel for capital cities:
And per capita bus travel up to 2021-22:
Note that Melbourne has the second highest volume of bus travel (being a large city), but the lowest per-capita usage of buses, primarily because – unlike most other cities – trams perform most of the busy on-street public transport task in the inner city. It probably doesn’t make sense to directly compare cities for bus patronage per capita, and indeed I won’t show such figures for the other public transport modes.
Darwin had elevated bus passenger kilometres from 2014 to 2019 due to bus services to a resources project (BITRE might not have counted these trips as urban public transport).
Ferry passenger travel
Sydney ferry patronage has almost recovered to pre-pandemic levels, while Brisbane’s ferries have not (as at 2022-23).
Light rail / tram passenger travel
Sydney light rail patronage is now growing strongly – after two new lines opened a few months before the pandemic hit.
Road deaths
In recent months there has been an uptick in road deaths in NSW and SA. Victorian road deaths dropped during the pandemic but are back to pre-pandemic levels.
It’s hard to compare total deaths between states with very different populations, so here are road deaths per capita, for financial years:
There is naturally more noise in this data for the smaller states and territories as the discrete number of trips in these geographies is small. The sparsely populated Northern Territory has the highest death rate, while the almost entirely urban ACT has the lowest death rate.
Another way of looking at the data is deaths per vehicle kilometre:
This chart is very similar – as vehicle kilometres per capita haven’t shifted dramatically.
Next is road deaths by road user type, including a close up of recent years for motorcycles, pedestrians, and cyclists. I’ve not distinguished between drivers and and passengers for both vehicles and motorcycles.
Vehicle occupant fatalities were trending down until around 2020. Motorcyclist fatalities have been relatively flat for a long time but have risen slightly since 2021.
Pedestrian fatalities were trending down until around 2014 and have been bouncing up and down since (perhaps a dip associated with COVID lock downs).
Cyclist fatalities have been relatively flat since the early 1990s (apart from a small peak in 2014).
It’s possible to distinguish between motorcycles and other vehicles for both deaths and vehicle kilometres travelled, and the following chart shows the ratio of these across time:
The death rate for motorcycle riders and passengers per motorcycle kilometre was 38 times higher than other vehicle types in 2022-23. The good news is that the death rate for other vehicles has dropped from 9.8 in 1989-90 to 2.7 in 2022-23. The death rate for motorcycles was trending down from 1991 to around 2015 but has since risen again in recent years.
Freight volumes and mode split
First up, total volumes:
This data shows a dramatic change in freight volume growth around 2019, with a lack of growth in rail volumes, a decline in coastal shipping, but ongoing growth in road volumes. Much of this volume is bulk commodities, and so the trends will likely be explained by changes in commodity markets, which I won’t try to unpack.
Non-bulk freight volumes are around a quarter of total freight volume, but are arguably more contestable between modes. They have flat-lined since 2021:
Here’s that by mode split:
In recent years road has been gaining mode share strongly at the expense of rail. This is a worrying trend if your policy objective is to reduce transport emissions as rail is inherently more energy efficient.
Air freight tonnages are tiny in the whole scheme of things so you cannot easily see them on the charts (air freight is only used for goods with very high value density).
Driver’s licence ownership
Here is motor vehicle licence ownership for people aged 15+ back to 1971 (I’d use 16+ but age by single-year data is only available at a state level back to 1982). Note this includes any form of driver’s licence including learner’s permits.
Technical note: the ownership rate is calculated as the sum of car, motorbike and truck licenses – including learner and probationary licences, divided by population. Some people have more than one driver’s licence so it’s likely to be an over-estimate of the proportion of the population with any licence.
Unfortunately data for June 2023 is only available for South Australia, Western Australia and Victoria, so we don’t know the latest trends in all states. South Australia and New South Wales regrettably appear to have recently stopped publishing useful licence holder numbers.
2023 saw a decline in licence ownership in the three states that reported. 2022 was a mixed bag with some states going up (NSW, South Australia, Tasmania), many flat, and the Northern Territory in decline.
Licence ownership rates have fluctuated in many states since the COVID19 pandemic hit, most notably in Victoria and NSW which saw a big uptick in 2021.
The data series for the ACT is unusually different in trends and values – with very high but declining rates in the 1970s, seemingly elevated rates from 2010 to around 2018, followed by a sharp drop. BITRE’s Information Sheet 84 (published in 2017) reports that ACT licences might remain active after people leave the territory (e.g. to nearby parts of NSW) because of delays in transferring their licences to another state, resulting in a mismatch between licence holder counts and population. However, New South Wales requires people to transfer their licence within 3 months of moving there, and other states likely do also. But that requirement might be new, changed, and/or differently enforced over time (please comment if you know more).
Here’s the breakdown of reported licence ownership by age band for the ACT:
Many age bands exceed 100 (more licence holders than population) and there are some odd kinks in the data around 2015-2017 for all age bands (especially 70-79). I’m not sure that it is plausible that licencing rates of teenagers might have plummeted quite so fast in recent years. I’m inclined to treat all of this ACT data as suspect, and I will therefore exclude the ACT from further charts with state/territory disaggregation.
Here’s licence ownership by age band for Australia as a whole (to June 2022):
Between 2021 and 2022 ownership rates for 16-24 year-olds fell slightly, while ownership rates continued to rise for older Australians (quite dramatically for those 80 and over, mostly due to NSW, see below).
Let’s look at the various age bands across the states:
Victoria saw a sharp decline in Victoria to June 2020, followed by a bounce back to a higher rate in 2021. The pandemic has also been associated with increased rates in South Australia, Tasmania, and New South Wales (although it dropped again in 2022). Western Australia and the Northern Territory have much lower licence rates, likely due to different eligibility ages for learner’s permits.
For 20-24 year olds the pandemic caused big increases in the rate of licence ownership in most states, however Victoria, South Australia, and Western Australian appear to have peaked. Licence ownership among 20-24 year olds was still surging in Tasmania up to June 2022.
Similar patterns are evident for 25-29 year olds:
One trend I identified a year ago was that the increasing rate of licence ownership seemed to largely reflect a decline in the population in these age bands during the pandemic period when temporary migrants were told to go home, and immigration almost ground to a halt. Most of the population decline was those without a licence, while the number of licence holders remained fairly steady.
New South Wales appears to follow this pattern, although there was strong growth in licence holders in 2021 and 2022 for teenagers.
Victoria saw a decline in licence holders in 2020 (likely teenagers unable to get a learner’s permit due to lockdowns), but the number of teenage licence holders has since grown. While for those in their 20s, the increase in the licence ownership rate is mostly explained by a loss of population without a licence:
Queensland has experienced strong growth in licence holders at the same time as a decline in population aged 20-29 in 2022. This might be the product of departing temporary immigrants partly offset by interstate migration to Queensland.
To illustrate how important migration is to the composition of young adults living in Australia, here’s a look at the age profile of net international immigration over time for Australia:
For almost all years, the age band 20-24 has had the largest net intake of migrants. This age band also saw declining rates of driver’s licence ownership – until the pandemic, when there was a big exodus and at the same time a significant increase in the drivers licence ownership rate. The younger adult age bands have seen a surge in 2022-23, and in the three states with data the licence ownership rates have dropped (as I predicted a year ago).
Curiously as an aside, 2019-20 saw a big increase in older people migrating to Australia (perhaps people who were overseas returning home during the pandemic lock downs). But then big negative numbers were seen in 2020-21, and since then there has continued to be net departures in 65+ age band.
For completeness, here are licence ownership rate charts for other age groups:
There appear to be a few dodgy outlier data points for the Northern Territory (2019) and South Australia (2016).
You might have noticed some upticks for New South Wales in 2022, particularly for those aged over 80. I’m not sure how to explain this. Here’s all the age bands for NSW:
Here’s Victoria, which includes data to 2023:
For completeness, here are motor cycle licence ownership rates:
Motorcycle licence ownership per capita has been declining in most states and territories, except Tasmania. I suspect dodgy data for New South Wales 2016, and Tasmania 2019.
Car ownership
Thankfully BITRE has picked up after the ABS terminated it’s Motor Vehicle Census, and are now producing a new annual report Motor Vehicle Australia. They’ve tried to replicate the ABS methodology, but inevitably have come up with slightly different numbers in different states for different vehicle types for 2021 (particularly Tasmania). So the following chart shows two values for January 2021 – both the ABS and BITRE figures so you can see the reset more clearly. I suggest focus on the gradient of the lines between surveys and try to ignore the step change in 2021.
Let’s zoom in on the top-right of that chart:
All except South Australia, Tasmania, and ACT showed a decline in motor vehicle ownership between January 2022 and January 2023. This might reflect the recent return of “recent immigrants” (as I predicted a year ago).
Tasmania had a large difference in 2021 estimates between ABS and BITRE that seems to be closing so who knows what might be going on there.
Several states appear to have had peaks – Tasmania in 2017, Western Australia in 2016, and ACT in 2017.
Vehicle fuel types
Petrol vehicles still dominate registered vehicles, but are slowly losing share to diesel:
Can you see that growing slither of blue at the top, being electric vehicles? Nor can I, so here’s the share of registered vehicles that are fully electric (battery or fuel cell, but not hybrids):
The almost entirely urban Australian Capital Territory is leading the country in electric vehicle adoption, while the Northern Territory is the laggard.
Motor vehicle sales
Here are motor vehicle sales by vehicle type:
The trend to larger and heavier vehicles (SUVs) might make it harder to bring down transport emissions (and perhaps reduce road deaths).
Electric vehicle sales are small but currently growing fast in volume and share:
[Updated 7 January 2024:] I’ve included calendar year 2023 sales from FCAI (their 2022 figures were very close to BITRE’s) and calculated the percentage of sales that were battery electric based on FCAI/ABS totals.
Transport Emissions
Transport now makes up 19% of Australia’s greenhouse gas emissions (excluding land use), up from 15% in 2001:
You can see that Australia’s total emissions excluding land use have actually increased since 2001. Emissions reductions in the electricity sector have been offset by increases in other sectors, including transport.
Australia’s transport rolling 12 month emissions dropped significantly with COVID lockdowns, but are bouncing back strongly:
Here are seasonally-adjusted quarterly estimates, showing September 2023 emissions back to 2018 levels:
Transport emissions are around 34% higher in September 2023 than in September 2001, the second highest growth of all sectors since that time:
Here are annual Australian transport emissions since 1975:
And in more detail since 1990:
The next chart shows the growth trends by sector since 1990:
Aviation emissions saw the biggest dip during the pandemic but are now back above 2018 levels.
Here are per capita emissions by transport sector (note: log scale used on Y-axis):
Truck and light commercial vehicle emissions per capita have continued to grow while many other modes have been declining, including a trend reduction in car emissions per capita since around 2004.
Next up, emissions intensity (per vehicle kilometre):
I suspect a blip in calculation assumptions in 2015 for bus and trucks.
Emissions per passenger kilometre can also be estimated:
Car emissions have continued a slow decline, but bus and aviation emissions per passenger km increased in 2021, presumably as the pandemic reduced average occupancy of these modes.
Aviation was reducing emissions per passenger kilometre strongly until around 2004, but has been relatively flat since, and the 2022-23 value is above 2004 levels. This seems a little odd as newer aircraft are generally more energy efficient.
Transport consumer costs
The final category for this post is the real cost of transport from a consumer perspective. Here are headline real costs (relative to CPI) for Australia, using quarterly ABS Consumer Price Index data up to September 2023:
Technical note: Private motoring is a combination of factors, including motor vehicle retail prices and automotive fuel.
The cost of motor vehicles was in decline from around 1995 to 2018 and has been stable or slightly rising since then. Automotive fuel has been volatile, which has contributed to variations in the cost of private motoring.
Urban transport fares (a category which unfortunately blends public transport and taxis/rideshare) have increased faster than CPI since the late 1970s, although they were flat in real terms between 2015 and 2020, then dropped in 2021 and 2022 in real terms – possibly as they had not yet been adjusted to reflect the recent surge in inflation. They picked up slightly in 2023.
The above chart shows a weighted average of capital cities, which washes out patterns in individual cities. Here’s a breakdown of the change in real cost of private motoring and urban transport fares since 1972 by city (note different Y-axis scales):
Technical note: The occasional dips in urban transport fares value are likely related to periods of free travel – eg May 2019 in Canberra.
The cost of private motoring moves much same across the cities.
Urban transport fares have grown the most in Brisbane, Perth, and Canberra – relative to 1972. However all cities have shown a drop in the real cost of urban transport fares in June 2022 – as discussed above.
If you choose a different base year you get a different chart:
What’s most relevant is the relative change between years – e.g. you can see Brisbane’s experiment with high urban transport fare growth between 2009 and 2017 in both charts.
Melbourne recorded a sharp drop in urban transport fares in 2015, which coincided with the capping of zone 1+2 fares at zone 1 prices.
And that’s a wrap on Australian transport trends. Hopefully you’ve found this useful and/or interesting.
I’ve been exploring why younger adults are more likely to use public transport, looking at data sets available for Melbourne. This fourth post in the series looks at the relationship between public transport mode share and income, socio-economic advantage/disadvantage, occupation, hours worked per week, and whether people are studying.
It concludes with a summary of the findings from the four posts in this series. For more detail about the data, see the first post in the series.
(note: I started writing this post quite a while ago – apologies I got distracted by new data releases including the 2021 census data)
Here’s an index as to which posts look at which factors (including many combinations of these factors):
part 1: age, sex, travelling to city centre (or not), workplace distance from CBD, education qualifications, home distance from CBD.
part 2: proximity to train stations, population density, job density, motor vehicle ownership, driver’s licence ownership.
part 3: parenthood, birth year, immigrant arrival year.
part 4 (this post): income, socio-economic advantage/disadvantage, occupation, hours worked per week, whether people are studying.
Income
Could income explain different levels of PT use by age, if older workers are earning more and therefore more able to afford to drive to work?
Well, do older adults actually earn more than younger adults? Here is the distribution of worker incomes by age group, split between people who work inside and outside the City of Melbourne, for the last pre-pandemic census (2016):
Apart from the few people still working in their 90s (presumably because they are making great money), income was generally highest for people in their 40s in 2016. Older working aged adults generally earnt less! This may well reflect the higher levels of educational attainment of younger adults (as we saw in part 1).
So the idea that older adults are driving to work because they are generally earning more just isn’t supported by the evidence.
The above chart also confirms people working in the City of Melbourne were much more likely to have higher incomes.
But is there a relationship between income and mode choice? The following chart shows public transport mode shares for journeys to work by both income bands and age.
Each line is for an income band, and you can see age-based variations in PT mode share for people within each income band. The biggest age-based variations were for people on lower incomes – with younger workers much more likely to use public transport than older workers.
There was less variation across age groups in public transport mode shares for people on higher incomes, particularly those working in the City of Melbourne.
Most of the higher income bands had high public transport mode shares for journeys to work in the City of Melbourne. The exception was the top band ($3000+ per week), many of whom probably have a car and/or parking space provided by their employer. Also, over 10% of people in the top income band walked or cycled to work which might be because they can afford to live close to work.
For those who worked outside the City of Melbourne, PT mode shares were generally higher for younger workers and those on lower incomes.
Here’s another view of the same data, with income on the X-axis and different colours used for different age ranges:
On this chart you can see income not having a strong relationship with PT mode share within many age groups. For those under 30, PT mode shares generally declined with increasing income. For workers over 40, mode shares slowly went up with income in the City of Melbourne, and declined slowly with increasing income for those working outside the City of Melbourne.
Overall it looks like age probably had a stronger relationship with PT mode shares than incomes, although both factors are relevant.
Here’s a chart that simply shows journey to work mode shares by personal income (regardless of age):
However, personal income is not necessarily the best measure here to measure the impact of income. A person living alone earning $2000 per week has more to spend on their transport than a person earning $2000 per week but also supporting a family. The ABS calculates a metric known as household-equivalised income, which considers total household income in the context of household size and composition. Unfortunately household equivalised income isn’t readily available for journey to work data which includes work location, hence why the above analysis uses personal income. But it is available if I’m only concerned with where people live.
Here’s a chart showing the relationship between household-equivalised income and mode shares for people who live in Greater Melbourne:
This chart is similar to the mode share chart for personal income, but there some noticeable differences at the lower incomes – with high private mode share for those on a household equivalised income between $300 and $1000 per week.
Public transport mode shares were highest at the top and bottom of the income spectrum, and lowest for those earning $400-$499 per week.
Similarly, active transport mode share was highest for the bottom and top income bands (probably out of necessity at the bottom end, and from living in walkable and cycling-friendly suburbs at the top end), while private transport mode share showed the inverse pattern, being highest for incomes between $400 and $1000 per week.
The above data was for journeys to work, but what about other travel purposes?
VISTA data shows some similar patterns for the income/age relationships, although the survey sample size doesn’t allow for a split between travel within/outside the City of Melbourne.
PT mode share was highest for those aged 10-29 for all income bands, although the relationship with income is more mixed.
For those in their 40s and 50s, PT mode share was generally higher for those in higher income bands (with the exception of the bottom income band), which may reflect home and work locations.
Younger children had very low public transport mode shares for all income ranges – which is consistent with other findings on this blog about young families.
Here’s an alternative view of the same data with income on the X-axis and a line per age group:
For those aged 30-59 PT mode share generally increased with income (possibly related to higher incomes more likely to work in the city centre), while for those aged 10-29 it generally declined with increasing income. Again, it would appear that age has a much stronger relationship with PT mode share than household income.
Here are overall travel mode shares by income:
It’s a little hard to see, but the mode share pattern is very similar to journeys to work. PT mode shares were higher for the lowest and second highest income bands and lower at middle income bands – with the exception of the highest income band which had much higher private transport mode share.
Socio-economic advantage/disadvantage
Firstly here is the distribution of Greater Melbourne population by age across the 10 deciles for ABS’s index of socio-economic advantage and disadvantage (part of SEIFA). Those deciles are actually for the state of Victoria, and because Melbourne is relatively advantaged compared to regional Victoria, there is a skew to higher deciles. 10 is for the most advantaged areas, and 1 is the most disadvantaged.
Similar to the analysis of income, people in their 40s were more likely to live in more advantaged areas.
Here is a chart of journey to work mode shares by advantage/disadvantage, split between workers aged 20-39 and 40-69:
Somewhat similar to the pattern with income, public transport mode shares were higher for both the most advantaged and most disadvantaged, bottoming out in the third (lowest) decile. This relationship held over younger and older workers, but there was still variance within age bands. When it comes to public transport use, both age and socio-economic advantage/disadvantage were relevant factors, but again it appears that age has a stronger relationship.
As an aside – because it is interesting – here are some charts showing the interaction between socio-economic advantage/disadvantage and other factors for explaining PT mode share, starting with motor vehicle ownership rates (measured at SA1 geography):
There was a relationship between PT mode share and both socio-economic disadvantage/advantage and motor vehicle ownership (except for areas with very high motor vehicle ownership), but motor vehicle ownership appears to have a much larger impact on PT mode share.
The following chart shows home distance from the CBD had a much stronger relationship with PT mode shares than socio-economic advantage/disadvantage:
The density of central city workers also was a much stronger determinant of average public transport mode share than socio-economic advantage/disadvantage:
Occupation
How do PT mode shares vary by occupation? And could variations in the occupation mix across age groups explain variations in PT mode share across age groups?
Firstly, here is the distribution of workers by occupation (using the most aggregated occupation categories defined by ABS), age, and work location (inside v outside City of Melbourne):
There is some variation in occupation distribution across age groups, with 15-19 and 20-29 the most different with many more sales workers and labourers (noting this data excludes people who did not commute to a workplace on census day). Workers aged 30-49 were more likely to be managers or professionals than most other age groups (consistent with income data).
The next chart shows public transport mode shares for journeys to work by occupation and age, disaggregated by other major factors that I have previously found to be significant: parenting status, work location, and immigrant status:
Clerical and administrative workers and professionals generally had the highest PT mode share for all categories. Labourers, machinery operators and (professional) drivers had the lowest PT mode shares, mostly followed by community and personal service workers (many of whom might do shift work – eg aged care, policing, emergency services, hospitality). Managers had significantly lower PT mode shares than professionals – perhaps due to company subsidised cars and/or parking.
You can see a clear relationship between age and public transport mode share in all “panes” of the chart. That is – even when you control for occupation and the other factors – there were still aged-related variations in public transport mode shares. Either some other factor is at work, of age itself is directly a factor influencing mode shares.
Hours worked
Does the amount of hours people worked in a week vary by age, and does it relate to PT mode shares?
Here is the distribution of hours worked by age group:
Workers aged 30-59 were most likely to be working 35+ hours per week, with those older and younger likely to be working fewer hours. So hours worked does not have a linear relationship with age for working-aged adults, and younger adults tend to work less hours.
So what was the relationship between hours worked, age, and PT mode share? Here’s a heat map table of PT mode share by hours worked and age band:
Technical note: you might be wondering why there is a “None” row. That’s for people who worked on census day, but didn’t work any hours in the previous week, for whatever reason.
This chart shows a very clear relationship between PT mode share and age for all ranges of hours worked.
You can also see public transport mode shares were generally highest for people working “full-time” (35-40 hours) and those who didn’t work in the previous week, and were generally lower for people who worked more then 40 hours (possibly working long shifts or multiple jobs – making public transport less convenient?) or less than 35 hours (juggling part-time paid work with other commitments?).
However this didn’t hold for those aged under 30, with full-time teenage workers less likely to use public transport. We’ve already seen that teenage workers generally had lower qualifications, were less likely to work in central Melbourne, less likely to work near a train station, less likely to work somewhere with high job density, less likely to be a recent immigrant, and more likely to work in occupations with lower public transport mode share.
On the bigger question, while PT mode share was generally higher for “full-time” workers, younger adults were less likely to be working full-time. So hours worked actually works against explaining why younger adults were more likely to use public transport.
Studying
Were younger adults more likely to use PT to get to work because they were more likely to also be students?
Certainly younger adults were more likely to be studying, although this dropped to only 10% for those in their 30s:
Here are average journey to work public transport modes shares by age and student-status:
So while workers who were studying certainly had much higher public transport mode shares than those not studying, there was still a strong relationship between age and PT mode share, regardless of whether workers were also students.
Which got me thinking – we’ve learnt that recent immigrants have been predominantly younger adults, and there have been many international students in Melbourne in recent years (at least up until the pandemic). Do these factors inter-play?
Firstly, census data certainly shows that more-recent immigrants were indeed much more likely to be studying, compared to the rest of the population:
In fact, over half of immigrants living in Melbourne who arrived in Australia between the start of 2016 and the census on 9 August 2016 were studying, and more than a third who arrived in the ten years before the census were studying.
So what if we control for how recently someone immigrated to Australia?
Within most arrival year bands, PT mode shares generally declined with age (except for those under 20). So again, these factors do not explain the total variations in public transport mode share by age.
For interest, here are public transport mode shares by student-status and year of arrival into Australia:
Full-time students who also worked were more likely to use public transport to get to work, although they were overtaken by part-time students for those who arrived before 1996. Also, recent immigrants who were not studying were still much more likely to use public transport.
Summary of geographic and demographic factors influencing public transport mode shares
I’ve covered a lot of material over four long posts. So here’s a summary of what I’ve learnt about demographics and public transport mode share in Melbourne in recent pre-pandemic years:
Public transport mode share (of all travel) was generally highest for older teenagers, and then fell away with age for those older or younger.
Public transport mode share of journeys to work was a little different – peaking for those aged in the mid 20s, and was much lower for teenagers and older adults.
Public transport mode share was generally higher in the following circumstances – all of which are generally more common for younger adults (and many of which are closely interrelated). Most of these relationships are quite strong.
Geographic factors:
living closer to the city centre (strong)
living closer to a train station (strong)
living in areas with higher residential densities
working closer to the city centre (strong)
working closer to a train station (strong)
working in areas with higher job density (strong)
generally travelling to destinations closer to the city centre (strong)
Demographic factors:
being highly educated
having lower rates of motor vehicle ownership (strong)
not owning a driver’s licence (strong)
not being a parent (strong), particularly a mother
being an immigrant, and having more recently immigrated to Australia (strong)
being a student (strong)
However, these factors don’t seem to fully explain why there are variations in public transport mode share by age (particularly for non-parents). I’ve controlled for several combinations of the stronger factors and still found variations across age bands. There’s likely to be something else about age that influences mode choice.
There are other factors (all demographic) that have a relationship with public transport mode shares, but these factors did not peak for young adults, unlike public transport mode share. So they actually work against explaining higher public transport use by younger adults. These saw higher public transport mode shares being associated with:
both very low and high incomes (but not the highest incomes)
both highly socio-economically advantaged areas and highly socio-economically disadvantaged areas
working full-time (35-40 hours per week)
having a professional or administrative/clerical occupation
not being a labourer, machinery operator, or professional driver
Women were more likely than men to use public transport to get to work for most age ranges (except ages 38-48), and this seems to be at least partly related to their higher levels of education, which in turn probably explains why they are more likely to work in the city centre.
Elsewhere on this blog I’ve uncovered other likely explanations for increased public transport mode share, including things such as increasing population density and employment density – see What might explain journey to work mode shifts in Australia’s largest cities? (2006-2016). However that analysis didn’t look at changes in the geography and demographics of people of different ages.
In this series I’ve confirmed some “demographic” factors that are related to public transport use that have also changed in favour of public transport use over those pre-pandemic years:
The proportion of the working population who are relatively recent immigrants had increased significantly, particularly for younger adults (see part 3). In 2006 just over 10% of people working in the City of Melbourne had arrived in Australia within the previous 10 years. In 2016 this was up to almost 18%. See also: Why were recent immigrants to Melbourne more likely to use public transport to get to work? Of course immigration all but ground to a halt in 2020 so this has probably contributed to reduce public transport mode share since.
But there have been other demographic shifts that probably worked against increasing public transport mode share over the pre-pandemic years:
The proportion of the working population who were parents rose from 22.6% to 27.1% for those working in the City of Melbourne, and from 25.3% to 27.3% for the rest of Greater Melbourne (2006 to 2016). As an aside: there was the little change in the average age of working parents – for women it went from 38.6 years in 2006 to 39.6 years in 2016 and for men it went from 40.0 to 40.3 years.
The proportion of people working in the City of Melbourne who were under 40 years of age declined slightly from 58.3% to 57.2% (2006 to 2016).
In a future post I might look at whether there has been a shift in where younger adults live and work geographically (eg proximity to the CBD, proximity to train stations, residential densities). This would be particularly interesting for the “post-pandemic” world, however it will probably need to wait for 2026 census data.
A lot of published transport analysis – including on this blog – has been gender-blind. Yet there are quite significant differences in travel patterns between men and women, and also between parents and non-parents. Advances in equality of opportunity have not eliminated these differences.
This post goes all-in with disaggregating a wide range of available data on transport behaviour on gender and parenting status in Melbourne, and explores some factors likely influencing these behaviours.
I will look at trip rates, trip chaining, time spent travelling, destination distance from home, distance travelled, travel to the central city, time of day, mode splits, use of different modes, trip purposes, and radial-ness of travel. I’ll also look at explanatory variables including main activity, occupation, employment industry, access to independent private mobility, and geographic distribution of home and work locations. Yeah that’s a lot, but don’t worry, there is a summary towards the end.
There’s also an interesting aside about dwelling bedroom counts around train stations.
This post is mostly focussed on working aged people (approximated by the age range 20-64), as children and seniors are likely to have different travel patterns again. And for the purposes of this analysis, I’m classifying people as “parents” or “parenting” if they live with their children – i.e. they are likely caring for their children (although some might have relatively independent adult children living with them). Parents whose adult children have all left home will be classified as other males/females.
About the data
I have access to very detailed household travel survey data for my home city of Melbourne for the pre-pandemic years 2012-2018, so that’s my primary source (officially VISTA – the Victorian Integrated Survey of Travel and Activity, get data here). It covers all types of non-commercial travel by residents, on all days of the year. Of course that data is pre-COVID and things will have changed somewhat since then but rich post-COVID data is not yet available.
I’m aggregating outputs to differentiate school weekdays, non-school weekdays, and weekends (I have excluded data for public holidays).
The VISTA data reports on binary gender, so unfortunately I can only cover males and females. That said, even if it did include more diverse gender categories, it would likely be very difficult to get statistically significant sample sizes for non-binary gender groupings.
There’s no special treatment required for same-sex parenting couples – they each count as mums or dads based on their reported gender.
Here’s how prevalent the different gender + parenting classifications are by age band in the weighted VISTA data for 2012-18:
The survey weightings don’t quite lead to a perfectly balance between genders across all age bands.
Parenting was most common amongst those aged 40-49 (almost three-quarters), and lower prevalence in younger and older age groups (under 8% for those aged 20-29).
Curiously there was a slight uptick in parents living with their children for ages 80+, which might be elderly parents living with – and being cared by – their adult children.
Across the approximate working aged population (20-64), parents accounted for 45% of the population.
In some sections I’ve also used ABS Census data from 2016 and 2021. This data is segmented slightly differently, with parenting being indicated by whether the person does unpaid work to care for their own children (so might exclude parents with relatively independent adult children living with them). Unless noted otherwise, it includes people aged 15+, and journey to work data only includes those who travelled to work and reported their travel modes.
Let’s get into it..
Trips per day
For this analysis a trip is travel between two places where a purposeful activity takes place, and may involve multiple trip legs (eg walk-bus-walk-train-walk).
Mums easily made the most number of trips on school weekdays, but dads made more trips on weekends than mums. Trip rates were higher on weekends for all person classifications except mums.
Trip chaining
I’ve heard much about women doing a lot more trip chaining – where a person leaves home and travels to one activity, then one or more other activities, before returning home. For example: home to school drop-off to work to school pickup to home.
As a simple measure of trip chaining, I’m counting the number of trips that don’t have an origin or destination at a place of accommodation (places of accommodation almost always being the survey home). I am aware of other definitions of trip chaining that only count where there is a short activity between trips but that would be require much more complex analysis.
As expected, mums were doing a lot of trip chaining on school weekdays, but curiously dads weren’t that far behind. And in the school holidays and on weekends dads were doing more train chaining than mums (perhaps to give mums a break?).
Trip chaining was much less common on weekends for all groups.
For mums the most common trip type not involving travel to or from home was between work and pick-up or drop-off of someone (most likely between a school and a workplace). A long way behind was travel between work and shopping, pick-up/drop-off someone and shopping, and between two pick-up/drop-off someone activities.
For dads the most common trip type not involving travel to/from home was between two work-related activities, closely followed by between work and pick-up / drop-off someone, and then between work and social activities.
So mums’ trip chaining was dominated by pick-ups and drop-offs of people, while dads’ was not.
Time spent travelling
There’s not a huge variation in median travel time per day between person groups, but dads had the highest on weekdays and mums generally had the lowest. Note that reported travel times were very often rounded to multiples of 5 minutes hence most of these medians are also multiples of 5.
Technical note: I have created a chart with average travel times and the numbers were higher but the shape of the chart was almost identical so I’m not including that here.
Travel distance from home
So were dads travelling further from home? I’ve calculated the straight distance between the home location and all travel destinations, and this chart shows the medians:
Dads sure did travel further from home on weekdays (particularly on school holidays when they might not be doing school drop-offs / pick-ups), with mums generally staying much closer to home.
Curiously, other males also travelled further from home than other females, so this pattern appears to be related to gender to some extent.
There was a lot less variation on weekends, with people generally travelling closer to home, as you might expect.
Daily distance travelled
Let’s broaden that out to median total distance travelled per day:
Dads generally travelled further on all day types, and mums the least. Everyone generally travelled less on weekends, and to some extent during school holidays (compared to school weekdays).
Travel distance to work
We can use ABS Census data to understand the on-road distance between home and workplaces, including for 2021. This data is for the working population aged 15+, and differentiates people based on whether they are caring for their own children (which is slightly different from living with their children).
The median distances to work were highest for dads at around 15.4 km for dads, followed by 11.9 km for mums, 11.7 km for other males, and 10.2 km for other females.
Travel to/from Central Melbourne
Public transport has its highest mode shares for travel to/from central Melbourne, so how did that vary by sex and parenting status? (for this analysis I’ve defined central Melbourne as the SA2s of Melbourne, Docklands, Southbank, and East Melbourne – on 2016 boundaries).
Before you get too excited about the differences, it’s worth pointing out all the proportions are small. The vast majority of people in Greater Melbourne don’t travel to central Melbourne on any given day. And of course people who lived in central Melbourne had many of their trips counted in this chart.
Sure enough, on weekdays dads were much more likely to travel to central Melbourne, and mums were least likely (although it was higher in the school holidays). On weekends, non-parents were much more likely to travel to the central city than parents (a fair bit of socialising by younger independent adults, no doubt).
Time of day of travel
The following chart shows the share of trip start times across the day for the different person types, and different day types:
Technical note: due to smaller sample sizes, weekend travel has been aggregated into 2-hour intervals. Weekdays have been aggregated into 1-hour intervals.
You can clearly see that on school weekdays, mums are doing a lot of travel between 8 and 9am, and between 3 and 4pm, which obviously relate to school start and finish times. In the school holidays, mums are doing a lot more travel through the interpeak period, probably reflecting parenting activities for kids not at school.
On school days, trips by dads started earlier and finished later than mums. But during school holidays dads made a smaller proportion of their trips between 8am and 9am, suggesting they also had a significant role in school drop offs in the morning.
During the weekday inter-peak period dads were less likely to travel than mums (except around lunchtime). Other females had a small peak in travel around 5-6pm, which is probably related to them being more likely to work full time.
On weekends it seems dads were slightly more likely to travel in the morning compared to mums who were slightly more likely to travel in the afternoon.
Did mum or dad take the kids to/from school?
We’re seeing some pretty strong themes related to the school peaks. It is possible to filter for trips to pick up or drop off someone from a place of education on school weekdays and then disaggregate between mums and dads. I’ve split this analysis into an AM peak, a PM school peak (2-4pm), and a PM commuter peak (4-6pm) – as there were significant numbers of pick ups later in the afternoon – presumably following after-school care.
Mums did the bulk of school drop offs and pick ups at all times of day, particularly in the PM school peak. In the PM commuter peak, dads share of pick ups rose to 35% – no doubt related to the ability to do these pick ups after a full-time day at work.
What types of adults are using modes at different times of day?
For this question I have limited analysis to school weekdays, aggregated all of public transport to one group, and aggregated vehicle drivers, passengers, and motorcyclists into “vehicle” to overcome issues with small sample sizes. I’ve included the proportion of the working aged population sample on the right-hand side for ready reference.
In general, parents were over-represented in vehicles in peak periods, mums were over-represented in the interpeak in vehicles, and parents were under-represented in public and active transport at most times of day.
The peak periods saw more public transport trips by dads than mums, while the roads (and footpaths) saw a lot more trips by mums than dads.
Early morning travel was predominately by males (76%), while females were slightly more prevalent in vehicles during the interpeak (60%). Reported walking trips skewed female at all times of day.
However if we look at travel time, rather trip counts, we get a slightly different picture:
Dads spent more time travelling than mums in peak periods on both public and private transport, but much less time than mums in the inter-peak.
Mode split
Here’s how it looks for travel in general:
Mums were the least likely to use public transport (especially on the weekend), closely followed by dads.
Non-parents had the lowest private transport mode share (although still a majority mode share), and were most likely to use active transport.
Here’s overall mode shares of journeys to work (Greater Melbourne 2016), which I’ve disaggregated for workplaces inside and outside the City of Melbourne area (as workplace location has a massive impact on mode shares):
Parents were much more likely to use private transport across the geographies and sexes. Of those working outside the City of Melbourne, parents also had about half the public transport mode share of non-parents.
Men were much more likely to cycle to work than women, and dads were more likely to cycle than other men.
Here is a look at private transport mode shares by distance between home and work, gender and parenting status:
The difference in private mode share between parents and non-parents was largest for journeys up to 10 km. Mums had the highest private mode share for journeys 1 to 20 kms. For journeys over 25 km, sex became more influential than parenting status with men more likely to use private transport.
Another curiosity here is the very short journeys (less than 0.5 km) where men were much more likely to use private transport than women (regardless of parenting status) – for what is probably a walkable distance for most people. Are men more lazy when it comes to short walks to work? And/or are men more likely to need their car at work?
For ages 35 to 59, mums generally had lower public transport mode share than dads. Younger non-parenting women had higher public transport mode shares than younger non-parenting men.
Here’s how it looks for 2016 journeys to work (I’m not using 2021 data because of COVID lockdowns):
Note there is a very different Y-axis scale for City of Melbourne and elsewhere.
There were a few really interesting take-aways:
Public transport (PT) mode shares increased over time for almost all age bands, work locations, and for parenting and non-parenting workers.
Parenting workers mostly had lower public transport mode shares than non-parenting workers of the same age, except for:
dads over 30 who worked in the City of Melbourne,
mums in their early 30s who worked in the City of Melbourne in 2016, and
mums and dads in their 50s who worked outside the City of Melbourne (who had low PT mode shares around 4-5%, similar to non-parenting workers of the same age)
Public transport mode shares for journeys to work in the City of Melbourne mostly declined with increasing age between 20 and 50, regardless of parenting responsibilities.
For people who worked outside the City of Melbourne, the mode share profile across age changed significantly over time for young adults. In 2006 there was a steady decline with age, but in 2011 PT mode shares were generally flat for those in their 20s, and in 2016 PT mode shares peaked for women in their late 20s (and also had a quite new pattern for dads in their 20s).
For parenting workers who worked outside the City of Melbourne there was actually a slightly higher PT mode share for those over the age of 50. Parents over 50 might have older children who are more independent and therefore less reliant on their parents for transport. This might make it easier for the parents to use public transport. However this trend did not hold for dads in 2016.
PT mode shares for non-parenting women increased slightly beyond age 55 for all work locations. This will include women who were never parents, as well mums with non-dependent children so might again reflect a small return to public transport once children become independent. It may also be influenced by discounted PT “Seniors” fares available to people over 60 who are not working 35+ hours per week.
Mode split of public transport use
Which modes of public transport were the different person classifications using in Melbourne? Sufficient survey sample is only available for school weekdays, and it’s important to keep in mind that trams dominate inner city radial on-street public transport in Melbourne (unlike most comparable cities where buses dominate this function). This chart adds up all trip legs so there is no data loss with multi-modal public trips:
Unfortunately this data doesn’t line up with reported public transport patronage for the same time period (below), suggesting that tram travel may be under-reported in VISTA (although the above chart is filtered for persons aged 20-64):
Biased as the VISTA data might be towards certain modes, it still suggests dads were more likely to be using trains and least likely to be using buses.
I’ve also looked at use of public transport in journeys to work for 2016. Workers can report up to three modes of travel, and I’ve extracted counts of workers who used each of the three main modes of public transport in Greater Melbourne (note: people who used multiple public transport modes will be counted in multiple columns).
Parents (who travelled to work) were much less likely use bus or tram to get to work than non parents. But the story is bit different for trains: Dads were slightly more likely to commute by train than other males, while mums were less likely to commute by train than other females. This might be related to where mums work – more on that soon.
Mode use by sex and parenting
We can flip the mode-split charts around to look at the composition of adult users of different travel modes:
Technical Note: there’s insufficient sample of tram, bus, and bicycle travel on non-school weekdays and weekends so those are not on the chart.
Trams, buses, private vehicles, and walking generally skewed female, while trains and particularly bicycles skewed male (except weekend trains).
Mums were under-represented on all modes except private vehicles where they were significantly over-represented. Mums were least represented on bicycles.
Dads were under-represented on trams and buses, and over-represented in vehicles, and on bicycles.
Non-parents were over-represented on trains and trams, and walking on weekends.
There were many more dads than mums on trains on weekdays, and many more mums than dads travelling in (private) vehicles on school weekdays (but not so much on weekends and school holidays).
Trip purposes
We want to know the purposes of people’s travel, but actually purpose can only really be attributed to the activity before and after a trip. For this analysis I’ve used the trip destination purpose as the trip purpose, and I’ve excluded trips where the destination was home (as that would be close to half of trips and not very interesting). Also keep in mind that trips can also vary considerably in length and duration.
On weekdays, significantly more trips by males were work-related. Mums had a standout different pattern on school weekdays with many more trips being about someone else’s travel (particularly school children) and much less often being work-related (or should we say “paid work”-related).
During school holidays, about 1 in 5 trips by mums were about other people’s travel. But on weekends dads were doing slightly more trips that are about other people’s travels (perhaps to make up for them doing less of such trips on weekdays?).
On weekends social and shopping trips were much more common than work trips, as you’d expect.
Radial-ness of travel
A while ago I looked at the radial-ness of travel – that is the difference in bearing (angle) between a trip aligned directly to/from the Melbourne CBD and the actual alignment of the trip. Trips generally skew towards being radial, reflecting the importance of the central city, and just generally the shape of the city. Previously I’ve disaggregated by age, sex, and many other variables.
So how does radial-ness vary across sex and parenting status?
On weekdays mums were the clear outlier, with substantially fewer radial trips and more non-radial trips, likely including many trips to/from schools and other caring destinations.
Weekend travel was a fair bit less radial in general, and again mums had the least radial travel of all person groups.
Okay so that’s a lot of ways we can compare travel patterns by sex and parenting (let me know if you think I’ve missed any other useful breakdowns). Now…
What can explain these differences?
A lot of the above data is probably unsurprising, because males and females, and particularly mums and dads, generally have different levels of workforce participation and caring responsibility, amongst other differences. What follows is an examination of potential explanatory variables for the different travel behaviour observed.
Main activity
First up, main activity as captured by VISTA:
Dads were most likely to be working full-time, and mums least likely to be working full-time. Mums were much more likely to be working part-time or “keeping house”.
As an aside: I actually find “keeping house” to be a bit devaluing of parents (usually mums) who dedicate much of their time doing the critically important work of raising children. And I know from personal experience it’s pretty hard to actually “keep house” when you have young children who need active engagement across most of their waking hours. No doubt others falling in the “keeping house” category might be caring for other adults or the elderly. Is it time for a caring-related category?
Curiously non-parenting females were much less likely to be working full time than non-parenting males. Perhaps non-parenting females were more likely to be doing some caring for others not living with them? Perhaps some mums decide to stay working part-time after their children move out? Or it might be something else?
We can break the analysis down further by age:
Technical note: Data isn’t presented for mums and dads aged 20-29 due to insufficient survey sample.
Curiously, dads were less likely to be working full-time with increasing age, while mums became slightly more likely to be working full-time at older ages (as children get older and require less supervision?).
Occupation (employment)
We call drill down further by looking at employment occupations:
Mums were much less likely to be in the workforce than dads, but curiously had almost the same proportion of professionals (perhaps reflecting women’s slightly higher levels of education, on average).
Men were more likely to work in occupations where public transport is probably less competitive, including technicians, trades workers, labourers, and machinery operators and drivers (with likely exceptions for central city work sites).
Employment Industry
There are also notable differences in employment industries by sex and parenting:
There are probably no great surprises in the above chart, with men much more likely to work in construction, information media and telecommunications, manufacturing, transport, postal, and warehousing, and women much more likely to work in education, training, health care, and social assistance.
Access to independent private mobility
Does the ability of people to drive themselves around in private vehicles differ by gender and parenting status? And could this explain their different travel patterns?
For this analysis, I’ve re-used the following household classifications from a previous post:
No MVs – no motor vehicles,
Limited MVs – fewer motor vehicles than licenced drivers, or
Saturated MVs – at least as many motor vehicles as licenced drivers.
I’ve also classified individuals as to whether or not they have a “solo” driving licence (i.e. probationary or full licence, but not learner’s permit).
I’ve then combined these two dimensions (except for people in households with no motor vehicles as driver’s licence ownership is largely immaterial for this analysis).
There were small differences between mums and dads, with mums slightly less likely to have a solo driver’s licence than dads (95% v 98%), mums slightly less likely to have independent private mobility (75.5% v 78.6%), and mums slightly more likely to live in a household without any motor vehicles (1.7% v 1.0%). These slight differences might suggest mums would have lower private transport mode shares than dads, but we’ve actually seen above that the opposite is true. Therefore access to independent private mobility is unlikely to explain much of the differences in travel between mums and dads.
There weren’t substantial differences between non-parenting men and women, other than non-parenting men having slightly high solo licence ownership (91% v 88%).
Parents were more likely to have a solo driver’s licence than non-parents, and over three-quarters lived in a household with saturated motor vehicle ownership. Access to independent private mobility aligns strongly with parents’ much higher private transport mode shares, and is probably considered essential for parents in most parts of Melbourne.
Indeed, we can also break this down by geography – using a simple inner/middle/outer disaggregation of Melbourne:
For all person categories there’s a strong relationship with distance from the city centre, with significantly lower levels of motor vehicle ownership in the inner areas. However solo licence ownership was very high for parents even in the inner suburbs (94% of mums and 98% of dads).
86% of dads and 87% of mums in outer Melbourne lived in households with saturation motor vehicle ownership. However, 5% of mums in the outer suburbs didn’t have a solo licence, which could make getting around quite challenging, and highlights the importance of quality public transport services in these areas.
Around 14% of non-parents in the inner suburbs lived in households without motor vehicles.
Where do parents tend to live?
It probably won’t surprise many readers to hear that parents made up a much larger share of the residential population in the outer suburbs, particularly urban growth areas:
But if you look closely, you’ll also see quite low proportions of parents along train lines, tram lines, and the public transport rich inner suburbs.
In fact, it’s possible to examine the type of households per dwelling by distance from train stations (I’m excluding areas within 3 km of the CBD).
Technical notes: I’ve calculated straight distance between SA1s centroids and their nearest train station points as per GTFS data in May 2024. The only significant change in train stations between August 2021 and May 2024 was the merger of Surrey Hills and Mont Albert into Union Station in 2023. So it’s not perfect analysis but I’m also not interested in precision below 1% resolution. I’ve also excluded unoccupied and non-private dwellings.
Dwellings close to train stations are significantly less likely to contain parents.
Is this because parents cannot afford family-friendly dwellings near train stations? Is it because dwellings near train stations are less family-friendly? Or is it because many parents like to build their own home on the urban fringe? Or some combination of these?
Well, the census tells us how many bedrooms there are in most occupied private dwellings, and the following chart shows the relationship between number of bedrooms and distance from train stations (again, excluding areas within 3 km of the CBD):
Sure enough, dwellings near train stations generally had fewer bedrooms.
And we can also use census data to show the relationship between number of bedrooms in a dwelling, and whether the household includes parents + children:
Over 90% of parenting households had three or more bedrooms, and half had four or more bedrooms. But almost half of all dwellings within 1 km of a train station had two or fewer bedrooms rendering them not very family-friendly.
Just to take it slightly further, I’ve put all three dimensions on one chart and this shows that dwellings close to stations with three or more bedrooms were slightly less likely to house parenting families:
I think the lower availability of family-friendly housing near rapid public transport is quite likely to be contributing to lower public transport mode shares for parents, particularly as there is a clear relationship between public transport use and proximity to rapid transit stations (see: Are Australian cities growing around their rapid transit networks?)
That said, there may also be an issue around whether many families can afford three-bedroom homes close to train stations as they often have less than two full-time incomes supporting three or more people. Might young professional couples with no kids and/or share houses of young professionals be better placed to compete for this housing?
Where do men and women work in Melbourne?
Could differences in journey to work mode splits be explained by differences in workplace location?
Here’s a map of gender balance by workplace location across Melbourne for 2021 at destination zone geography (DZs) (sorry not all outer suburbs included on the map as I didn’t want to lose the inner area detail). Blue areas skew male, orange areas skew female.
Anyone with knowledge of Melbourne’s urban geography will instantly see large industrial areas shaded blue, and plenty of orange in most other places.
These skews follow industries with male and female dominant workforces. In fact, I’ve manually done some rough grouping of destination zones where there is a clear dominant land uses (not exhaustive but results should be fairly indicative), and here is the sex breakdown by land use type:
Industrial areas and Melbourne Airport skewed heavily male, while hospitals and large shopping centres skewed female. Universities skewed female, and the CBD and surrounding areas slightly skewed male.
What about parenting? Something to keep in mind is that 43% of the working population were living with their children.
Parenting workers were seen more in the middle and outer suburbs, which is also where parents skewed as a home location, so there’s undoubtedly a relationship there.
Here’s the parenting breakdown by dominant land use classification:
Parents were under-represented in major shopping centres (I’m guessing a skew to younger employees), but also to a small extent universities and the central city. Parents were slightly over-represented in hospitals, Melbourne Airport, industrial areas, and the rest of Melbourne.
Another way to represent this data is looking at the distribution of workplace locations by distance from the Melbourne CBD:
Probably the biggest stand-out is that mums skewed towards suburban employment locations, while non-parenting females were more likely to be working closer to the city centre.
The distribution of workplace distance from the CBD for males only differed slightly between those parenting and non-parenting. Dads were less likely to be work between 2-10 km from the Melbourne CBD than non-parenting males.
Employment density
I’ve previously shown that private transport mode shares are generally much lower in areas with higher job density (likely due to higher car parking costs and increased public transport accessibility). So do mums/dads/others typically work in areas of lower or higher job density, and could this explain differences in their mode splits?
To answer this I’ve calculated an aggregate weighted job density of the areas in which each category of person tends to work. How does that work? Well to start with I’ve calculated the job density of every destination zone in Greater Melbourne. I’ve then calculated a weighted average of these densities, where the density of each destination zone is weighted by the number of dads/mums/other males/other females working in that zone.
For females, those non-parenting generally worked in more jobs dense areas, compared to mums. This probably partly explains the lower public transport mode shares of mums.
For males it was the reverse – dads generally worked in more jobs-dense locations.
Overall was only a tiny difference between men and women in aggregated weighted job density:
That was a lot of charts, can you summarise that?
The following table attempts to highlight key variations from the overall average for different types of adults:
Type of adult
Travel patterns
Destination patterns
Mode split
Explanatory factors
Parents
More trips per person on weekdays. More trip chaining.
Higher private mode share.
Live further from public transport. Lack of family-friendly dwellings near public transport. Live in outer suburbs. Higher car ownership.
Mums
More travel during weekday interpeak. Highest trip chaining.
Travel closer to home. Work closer to home. Less radial travel. Least likely to work in CBD.
Very high private transport mode share.
Do most school drop offs / pick ups. Least likely to work full time. Less likely to work in job-dense areas.
Dads
Travel longer distances. Travel further from home. More time spent travelling.
Travel further from home. Work further from home. More likely to work in CBD.
More likely to use trains. More likely to use bicycles.
Most likely to work full time. More likely to work in job-dense areas.
Non-parenting women
Travel closer to home. Work closer to home.
Higher public transport use.
More likely to work in job-dense areas. Most likely to work in central city.
The explanatory factors in the right hand column will not be independent. For example, many parents probably find it infeasible to live near public transport, so they live further away and are more car-dependent.
What does all this mean for transport planning interventions?
I won’t say a lot on this topic (I tend to avoid policy prescriptions on this blog) but I will say I think some caution is required here.
One perspective might be that the proportion of males and females travelling on a mode at a particular time of the week will not change, and therefore interventions might predominantly benefit the existing user base (eg higher inter-peak public transport service frequencies might benefit women more than men).
However another perspective might be that interventions remove the barriers for one gender to utilise a mode of transport and might have significant benefits for the minority gender in the current user base. For example, significantly safer cycling infrastructure might encourage more women to cycle and lead to a more even balance between genders – indeed I’ve uncovered evidence about that on this blog.
So many mums driving kids to school!
One thing that really stands out to me is that mums do the vast majority of school drop offs and pick ups, and most of this travel is (now) happening by private vehicle. This is potentially impacting women’s workforce participation, and the traffic volumes are certainly contributing to road congestion. It might also be impacting women’s mode choices as school trips are generally more difficult on public transport, and mums do a lot of trip chaining. They might be using private transport for some trips mostly because those trips are chained with school drop-off/pick-ups.
What could you do to reduce private transport trips for school drop off / pick ups, and potentially also increase women’s workforce participation and public transport mode share?
Make interventions that increase the share of school students who travel to/from school independently by active or public transport
For school trips that are accompanied by a parent, encourage a mode shift towards active transport (realistically, public transport is less likely to be an attractive mode for many accompanied trips to school, unless it is on the way to another destination)
Provide at-school before-school and after-school care to enable both parents the opportunity to work full time (indeed government subsidies are provided in Victoria at least)
How might things have have changed post-COVID?
Unfortunately at the time of writing rich data is only really available for pre-COVID times.
A major change post-COVID is that many white collar professionals are now working from home some days per week, which has reduced travel to major office precincts.
I would not be surprised to see dads taking a slightly higher share of the school drop-off pick-up task as this can be easier to do on a work-from-home day. Might this have enabled women to work longer hours? There have also been higher child-care subsidies implemented recently that might also lift women’s workforce participation.
Indeed here’s a chart summarising female labour force status since 2012 (not seasonally-adjusted):
Technical note: I would have preferred to use seasonally adjusted or trend series numbers to remove the noise, but these data sets do not include counts for “not in labour force”
Following the major COVID disruption period around 2020-2021, women have been more likely to be working full time and more likely to be in the labour force. This might be partly related to new working-from-home patterns.
Hopefully more post-COVID travel data will be released before too long and I can investigate if there are any substantial shifts in the patterns between men and women, parents and non-parents.
Do let me know if you think there is more that should explored regarding the differences in travel patterns and explanatory variables for men and women, parents and non-parents.